Advance Auto Parts 2015 Annual Report Download - page 33
Download and view the complete annual report
Please find page 33 of the 2015 Advance Auto Parts annual report below. You can navigate through the pages in the report by either clicking on the pages listed below, or by using the keyword search tool below to find specific information within the annual report.-
 1
1 -
2
-
3
-
4
-
5
-
6
-
7
-
8
-
9
-
10
-
11
-
12
-
13
-
14
-
15
-
16
-
17
-
18
-
19
-
20
-
21
-
22
-
 23
23 -
 24
24 -
 25
25 -
 26
26 -
 27
27 -
 28
28 -
 29
29 -
 30
30 -
 31
31 -
 32
32 -
 33
33 -
 34
34 -
 35
35 -
 36
36 -
 37
37 -
 38
38 -
 39
39 -
 40
40 -
 41
41 -
 42
42 -
 43
43 -
44
-
45
-
46
-
47
-
48
-
49
-
50
-
51
-
52
-
53
-
54
-
55
-
56
-
57
-
58
-
59
-
60
-
61
-
62
-
63
-
64
-
65
-
66
-
67
-
68
-
69
-
70
-
71
-
72
-
73
-
74
-
75
-
76
-
77
-
78
-
79
-
80
-
81
-
82
-
83
-
84
-
85
-
86
-
87
-
88
-
89
-
90
-
91
-
92
-
93
-
94
-
95
-
96
-
97
-
98
-
99
-
100
-
101
-
102
-
103
-
104
-
105
-
106
-
107
-
108
-
109
-
110
-
111
-
112
 |
 |

20
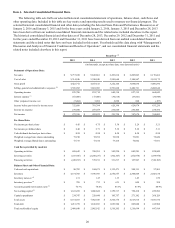
Item 6. Selected Consolidated Financial Data.
The following table sets forth our selected historical consolidated statement of operations, balance sheet, cash flows and
other operating data. Included in this table are key metrics and operating results used to measure our financial progress. The
selected historical consolidated financial and other data (excluding the Selected Store Data and Performance Measures) as of
January 2, 2016 and January 3, 2015 and for the three years ended January 2, 2016, January 3, 2015 and December 28, 2013
have been derived from our audited consolidated financial statements and the related notes included elsewhere in this report.
The historical consolidated financial and other data as of December 28, 2013, December 29, 2012 and December 31, 2011 and
for the years ended December 29, 2012 and December 31, 2011 have been derived from our audited consolidated financial
statements and the related notes that have not been included in this report. You should read this data along with “Management’s
Discussion and Analysis of Financial Condition and Results of Operations”, and our consolidated financial statements and the
related notes included elsewhere in this report.
Fiscal Year (1)
2015 2014 2013 2012 2011
(in thousands, except per share data, store data and ratios)
Statement of Operations Data:
Net sales $ 9,737,018 $ 9,843,861 $ 6,493,814 $ 6,205,003 $ 6,170,462
Cost of sales 5,314,246 5,390,248 3,241,668 3,106,967 3,101,172
Gross profit 4,422,772 4,453,613 3,252,146 3,098,036 3,069,290
Selling, general and administrative expenses (2) 3,596,992 3,601,903 2,591,828 2,440,721 2,404,648
Operating income 825,780 851,710 660,318 657,315 664,642
Interest expense (3) (65,408) (73,408) (36,618) (33,841) (30,949)
Other (expense) income, net (7,484) 3,092 2,698 600 (457)
Income before provision for income taxes 752,888 781,394 626,398 624,074 633,236
Income tax expense 279,490 287,569 234,640 236,404 238,554
Net income $ 473,398 $ 493,825 $ 391,758 $ 387,670 $ 394,682
Per Share Data:
Net income per basic share $ 6.45 $ 6.75 $ 5.36 $ 5.29 $ 5.21
Net income per diluted share $ 6.40 $ 6.71 $ 5.32 $ 5.22 $ 5.11
Cash dividends declared per basic share $ 0.24 $ 0.24 $ 0.24 $ 0.24 $ 0.24
Weighted average basic shares outstanding 73,190 72,932 72,930 73,091 75,620
Weighted average diluted shares outstanding 73,733 73,414 73,414 74,062 77,071
Cash flows provided by (used in):
Operating activities $ 689,642 $ 708,991 $ 545,250 $ 685,281 $ 828,849
Investing activities $ (253,366) $ (2,288,237) $ (362,107) $ (272,978) $ (289,974)
Financing activities $ (445,952) $ 575,911 $ 331,217 $ 127,907 $ (540,183)
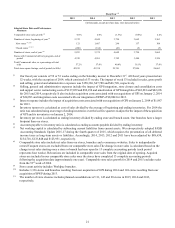
Balance Sheet and Other Financial Data:
Cash and cash equivalents $ 90,782 $ 104,671 $ 1,112,471 $ 598,111 $ 57,901
Inventory $ 4,174,768 $ 3,936,955 $ 2,556,557 $ 2,308,609 $ 2,043,158
Inventory turnover (4) 1.31 1.47 1.33 1.43 1.59
Inventory per store (5) $ 789 $ 733 $ 631 $ 609 $ 558
Accounts payable to Inventory ratio (6) 76.7% 78.6% 85.3% 87.9% 80.9%
Net working capital (7) $ 1,143,269 $ 1,086,624 $ 1,359,317 $ 758,410 $ 229,896
Capital expenditures $ 234,747 $ 228,446 $ 195,757 $ 271,182 $ 268,129
Total assets $ 8,134,565 $ 7,962,358 $ 5,564,774 $ 4,613,814 $ 3,655,754
Total debt $ 1,213,759 $ 1,636,893 $ 1,053,584 $ 605,088 $ 415,984
Total stockholders' equity $ 2,460,648 $ 2,002,912 $ 1,516,205 $ 1,210,694 $ 847,914