Advance Auto Parts 2015 Annual Report Download - page 71
Download and view the complete annual report
Please find page 71 of the 2015 Advance Auto Parts annual report below. You can navigate through the pages in the report by either clicking on the pages listed below, or by using the keyword search tool below to find specific information within the annual report.-
 1
1 -
2
-
3
-
4
-
5
-
6
-
7
-
8
-
9
-
10
-
11
-
12
-
13
-
14
-
15
-
16
-
17
-
18
-
19
-
20
-
21
-
22
-
23
-
24
-
25
-
26
-
27
-
28
-
29
-
30
-
31
-
32
-
33
-
34
-
35
-
36
-
37
-
38
-
39
-
40
-
41
-
42
-
43
-
44
-
45
-
46
-
47
-
48
-
49
-
50
-
51
-
52
-
53
-
54
-
55
-
56
-
57
-
58
-
59
-
60
-
 61
61 -
 62
62 -
 63
63 -
 64
64 -
 65
65 -
 66
66 -
 67
67 -
 68
68 -
 69
69 -
 70
70 -
 71
71 -
 72
72 -
 73
73 -
 74
74 -
 75
75 -
 76
76 -
 77
77 -
 78
78 -
 79
79 -
 80
80 -
 81
81 -
82
-
83
-
84
-
85
-
86
-
87
-
88
-
89
-
90
-
91
-
92
-
93
-
94
-
95
-
96
-
97
-
98
-
99
-
100
-
101
-
102
-
103
-
104
-
105
-
106
-
107
-
108
-
109
-
110
-
111
-
112
 |
 |

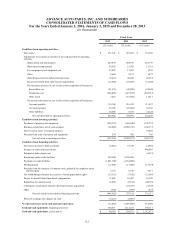
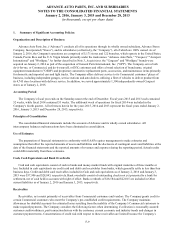
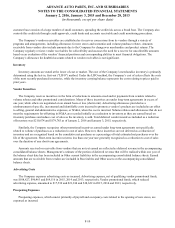
ADVANCE AUTO PARTS, INC. AND SUBSIDIARIES
NOTES TO THE CONSOLIDATED FINANCIAL STATEMENTS
January 2, 2016, January 3, 2015 and December 28, 2013
(in thousands, except per share data)
F-17
periods and interim periods within those annual periods beginning after December 15, 2015; earlier adoption is permitted. The
adoption of this guidance is not expected to have a material impact on the Company's consolidated financial condition, results
of operations or cash flows.
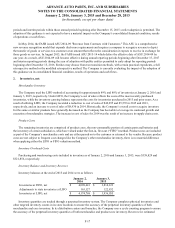
In May 2014, the FASB issued ASU 2014-09 "Revenue from Contracts with Customers." This ASU is a comprehensive
new revenue recognition model that expands disclosure requirements and requires a company to recognize revenue to depict
the transfer of goods or services to a customer at an amount that reflects the consideration it expects to receive in exchange for
those goods or services. In August 2015, the FASB issued ASU 2015-14 which defers the effective date of ASU 2014-09 by
one year. As a result, ASU 2014-09 will become effective during annual reporting periods beginning after December 15, 2017
and interim reporting periods during the year of adoption with public entities permitted to early adopt for reporting periods
beginning after December 15, 2016. Entities may choose from two transition methods, with certain practical expedients, a full
retrospective method or the modified retrospective method. The Company is currently evaluating the impact of the adoption of
this guidance on its consolidated financial condition, results of operations and cash flows.
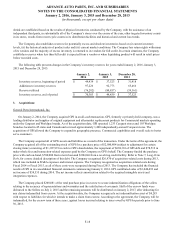
2. Inventories, net:
Merchandise Inventory
The Company used the LIFO method of accounting for approximately 89% and 88% of inventories at January 2, 2016 and
January 3, 2015, respectively. Under LIFO, the Company’s cost of sales reflects the costs of the most recently purchased
inventories, while the inventory carrying balance represents the costs for inventories purchased in 2015 and prior years. As a
result of utilizing LIFO, the Company recorded a reduction to cost of sales of $42,295 and $5,572 in 2015 and 2013,
respectively, and an increase to cost of sales of $8,930 in 2014. Historically, the Company’s overall costs to acquire inventory
for the same or similar products have generally decreased as the Company has been able to leverage its continued growth and
execution of merchandise strategies. The increase in cost of sales for 2014 was the result of an increase in supply chain costs.
Product Cores
The remaining inventories are comprised of product cores, the non-consumable portion of certain parts and batteries and
the inventory of certain subsidiaries, which are valued under the first-in, first-out (“FIFO”) method. Product cores are included
as part of the Company’s merchandise costs and are either passed on to the customer or returned to the vendor. Because product
cores are not subject to frequent cost changes like the Company’s other merchandise inventory, there is no material difference
when applying either the LIFO or FIFO valuation method.
Inventory Overhead Costs
Purchasing and warehousing costs included in inventory as of January 2, 2016 and January 3, 2015, were $359,829 and
$321,856, respectively.
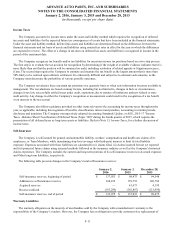
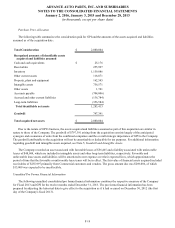
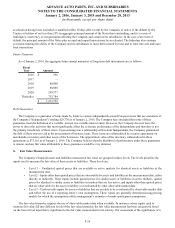
Inventory Balance and Inventory Reserves
Inventory balances at the end of 2015 and 2014 were as follows:
January 2,
2016
January 3,
2015
Inventories at FIFO, net $ 4,009,641 $ 3,814,123
Adjustments to state inventories at LIFO 165,127 122,832
Inventories at LIFO, net $ 4,174,768 $ 3,936,955
Inventory quantities are tracked through a perpetual inventory system. The Company completes physical inventories and
other targeted inventory counts in its store locations to ensure the accuracy of the perpetual inventory quantities of both
merchandise and core inventory. In its distribution centers and branches, the Company uses a cycle counting program to ensure
the accuracy of the perpetual inventory quantities of both merchandise and product core inventory. Reserves for estimated