Advance Auto Parts 2015 Annual Report Download - page 60
Download and view the complete annual report
Please find page 60 of the 2015 Advance Auto Parts annual report below. You can navigate through the pages in the report by either clicking on the pages listed below, or by using the keyword search tool below to find specific information within the annual report.-
 1
1 -
2
-
3
-
4
-
5
-
6
-
7
-
8
-
9
-
10
-
11
-
12
-
13
-
14
-
15
-
16
-
17
-
18
-
19
-
20
-
21
-
22
-
23
-
24
-
25
-
26
-
27
-
28
-
29
-
30
-
31
-
32
-
33
-
34
-
35
-
36
-
37
-
38
-
39
-
40
-
41
-
42
-
43
-
44
-
45
-
46
-
47
-
48
-
49
-
 50
50 -
 51
51 -
 52
52 -
 53
53 -
 54
54 -
 55
55 -
 56
56 -
 57
57 -
 58
58 -
 59
59 -
 60
60 -
 61
61 -
 62
62 -
 63
63 -
 64
64 -
 65
65 -
 66
66 -
 67
67 -
 68
68 -
 69
69 -
 70
70 -
71
-
72
-
73
-
74
-
75
-
76
-
77
-
78
-
79
-
80
-
81
-
82
-
83
-
84
-
85
-
86
-
87
-
88
-
89
-
90
-
91
-
92
-
93
-
94
-
95
-
96
-
97
-
98
-
99
-
100
-
101
-
102
-
103
-
104
-
105
-
106
-
107
-
108
-
109
-
110
-
111
-
112
 |
 |

F-6
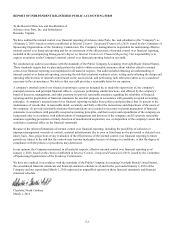
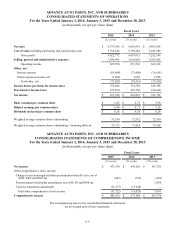
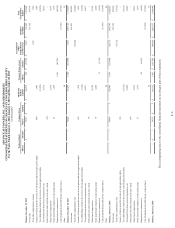
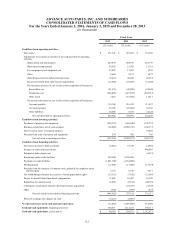
ADVANCE AUTO PARTS, INC. AND SUBSIDIARIES
CONSOLIDATD STATEMENTS OF CHANGES IN STOCKHOLDERS' EQUITY
For the Years Ended January 2, 2016, January 3, 2015 and December 28, 2013
(in thousands)
Preferred Stock Common Stock Additional
Paid-in
Capital
Treasury Stock, at cost
Accumulated
Other
Comprehensive
Income (Loss)
Retained
Earnings
Total
Stockholders'
Equity
Shares Amount Shares Amount Shares Amount
Balance, December 29, 2012 — $ — 73,731 $ 7 $ 520,215 348 $ (27,095) $ 2,667 $ 714,900 $ 1,210,694
Net income 391,758 391,758
Total other comprehensive income 1,016 1,016
Issuance of shares upon the exercise of stock options and stock appreciation rights 480 1,903 1,903
Tax withholdings related to the exercise of stock appreciation rights (21,856)(21,856)
Tax benefit from share-based compensation, net 16,132 16,132
Restricted stock and restricted stock units vested (10) —
Share-based compensation 13,191 13,191
Stock issued under employee stock purchase plan 23 1,679 1,679
Repurchase of common stock 1,036 (80,795) (80,795)
Cash dividends declared ($0.24 per common share) (17,546) (17,546)
Other 29 29
Balance, December 28, 2013 — — 74,224 7 531,293 1,384 (107,890) 3,683 1,089,112 1,516,205
Net income 493,825 493,825
Total other comprehensive loss (16,020) (16,020)
Issuance of shares upon the exercise of stock options and stock appreciation rights 162 1,874 1,874
Tax withholdings related to the exercise of stock appreciation rights (7,102)(7,102)
Tax benefit from share-based compensation, net 10,471 10,471
Restricted stock and restricted stock units vested 68 —
Share-based compensation 21,705 21,705
Stock issued under employee stock purchase plan 39 4,660 4,660
Repurchase of common stock 35 (5,154) (5,154)
Cash dividends declared ($0.24 per common share) (17,596) (17,596)
Other 44 44
Balance, January 3, 2015 — — 74,493 7 562,945 1,419 (113,044) (12,337) 1,565,341 2,002,912
Net income 473,398 473,398
Total other comprehensive loss (31,722) (31,722)
Issuance of shares upon the exercise of stock appreciation rights 138 —
Tax withholdings related to the exercise of stock appreciation rights (13,112)(13,112)
Tax benefit from share-based compensation, net 12,989 12,989
Restricted stock and restricted stock units vested 109 —
Share-based compensation 35,336 35,336
Stock issued under employee stock purchase plan 35 5,139 5,139
Repurchase of common stock 42 (6,665) (6,665)
Cash dividends declared ($0.24 per common share) (17,662) (17,662)
Other 35 35
Balance, January 2, 2016 — $ — 74,775 $ 7 $ 603,332 1,461 $ (119,709) $ (44,059) $ 2,021,077 $ 2,460,648
The accompanying notes to the consolidated financial statements are an integral part of these statements.