Advance Auto Parts 2006 Annual Report Download - page 98
Download and view the complete annual report
Please find page 98 of the 2006 Advance Auto Parts annual report below. You can navigate through the pages in the report by either clicking on the pages listed below, or by using the keyword search tool below to find specific information within the annual report.-
 1
1 -
2
-
3
-
4
-
5
-
6
-
7
-
8
-
9
-
10
-
11
-
12
-
13
-
14
-
15
-
16
-
17
-
18
-
19
-
20
-
21
-
22
-
23
-
24
-
25
-
26
-
27
-
28
-
29
-
30
-
31
-
32
-
33
-
34
-
35
-
36
-
37
-
38
-
39
-
40
-
41
-
42
-
43
-
44
-
45
-
46
-
47
-
48
-
49
-
50
-
51
-
52
-
53
-
54
-
55
-
56
-
57
-
58
-
59
-
60
-
61
-
62
-
63
-
64
-
65
-
66
-
67
-
68
-
69
-
70
-
71
-
72
-
73
-
74
-
75
-
76
-
77
-
78
-
79
-
80
-
81
-
82
-
83
-
84
-
85
-
86
-
87
-
 88
88 -
 89
89 -
 90
90 -
 91
91 -
 92
92 -
 93
93 -
 94
94 -
 95
95 -
 96
96 -
 97
97 -
 98
98 -
 99
99 -
 100
100 -
 101
101 -
 102
102 -
 103
103 -
 104
104 -
 105
105 -
 106
106 -
 107
107 -
 108
108 -
109
-
110
-
111
-
112
 |
 |

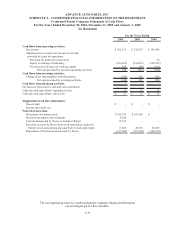
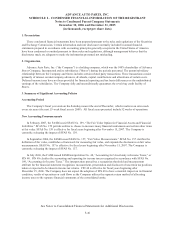
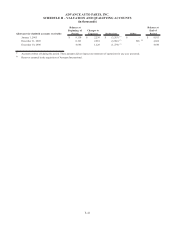
ADVANCE AUTO PARTS, INC. AND SUBSIDIARIES
NOTES TO CONSOLIDATED FINANCIAL STATEMENTS – (Continued)
December 30, 2006, December 31, 2005 and January 1, 2005
(in thousands, except per share data)
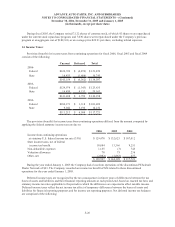
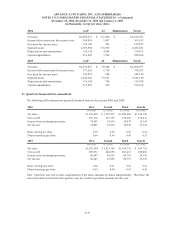
2006 AAP AI Eliminations Totals
Net sales 4,505,437$ 111,066$ -$ 4,616,503$
Income before provision for income taxes 368,818 1,097 - 369,915
Provision for income taxes 138,144 453 - 138,597
Segment assets 2,565,986 116,695 - 2,682,681
Depreciation and amortization 135,159 4,264 - 139,423
Capital expenditures 251,024 7,562 - 258,586
2005 AAP AI Eliminations Totals
Net sales 4,234,667$ 30,304$ -$ 4,264,971$
Income before provision for income taxes 377,205 1,718 - 378,923
Provision for income taxes 143,514 684 - 144,198
Segment assets 2,446,226 95,923 - 2,542,149
Depreciation and amortization 119,184 754 - 119,938
Capital expenditures 215,585 629 - 216,214
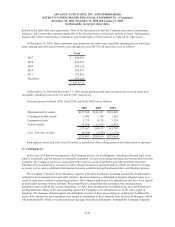
21. Quarterly Financial Data (unaudited):
The following table summarizes quarterly financial data for fiscal years 2006 and 2005:
2006 First Second Third Fourth
(16 weeks) (12 weeks) (12 weeks) (12 weeks)
Net sales 1,393,010$ 1,107,857$ 1,099,486$ 1,016,150$
Gross profit 665,168 527,359 530,206 478,431
Income from continuing operations 74,081 62,936 58,947 35,354
Net income 74,081 62,936 58,947 35,354
Basic earning per share 0.69 0.60 0.56 0.34
Diluted earnings per share 0.68 0.59 0.56 0.33
2005 First Second Third Fourth
(16 weeks) (12 weeks) (12 weeks) (12 weeks)
Net sales 1,258,364$ 1,023,146$ 1,019,736$ 963,725$
Gross profit 600,931 482,050 481,415 450,082
Income from continuing operations 68,647 65,929 60,793 39,356
Net income 68,647 65,929 60,793 39,356
Basic earnings per share 0.64 0.61 0.56 0.36
Diluted earnings per share 0.63 0.60 0.55 0.36
Note: Quarterly and year-to-date computations of per share amounts are made independently. Therefore, the
sum of per share amounts for the quarters may not round to per share amounts for the year.
F-35