Advance Auto Parts 2006 Annual Report Download - page 69
Download and view the complete annual report
Please find page 69 of the 2006 Advance Auto Parts annual report below. You can navigate through the pages in the report by either clicking on the pages listed below, or by using the keyword search tool below to find specific information within the annual report.-
 1
1 -
2
-
3
-
4
-
5
-
6
-
7
-
8
-
9
-
10
-
11
-
12
-
13
-
14
-
15
-
16
-
17
-
18
-
19
-
20
-
21
-
22
-
23
-
24
-
25
-
26
-
27
-
28
-
29
-
30
-
31
-
32
-
33
-
34
-
35
-
36
-
37
-
38
-
39
-
40
-
41
-
42
-
43
-
44
-
45
-
46
-
47
-
48
-
49
-
50
-
51
-
52
-
53
-
54
-
55
-
56
-
57
-
58
-
 59
59 -
 60
60 -
 61
61 -
 62
62 -
 63
63 -
 64
64 -
 65
65 -
 66
66 -
 67
67 -
 68
68 -
 69
69 -
 70
70 -
 71
71 -
 72
72 -
 73
73 -
 74
74 -
 75
75 -
 76
76 -
 77
77 -
 78
78 -
 79
79 -
80
-
81
-
82
-
83
-
84
-
85
-
86
-
87
-
88
-
89
-
90
-
91
-
92
-
93
-
94
-
95
-
96
-
97
-
98
-
99
-
100
-
101
-
102
-
103
-
104
-
105
-
106
-
107
-
108
-
109
-
110
-
111
-
112
 |
 |

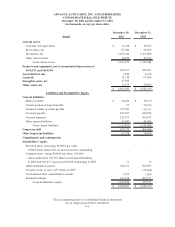
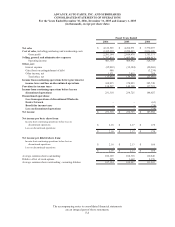
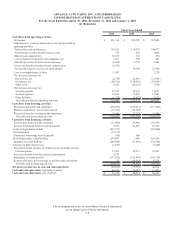
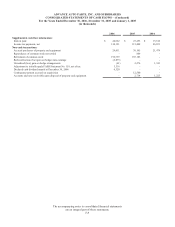
ADVANCE AUTO PARTS, INC. AND SUBSIDIARIES
CONSOLIDATED STATEMENTS OF OPERATIONS
For the Years Ended December 30, 2006, December 31, 2005 and January 1, 2005
(in thousands, except per share data)
2006 2005 2004
Net sales 4,616,503$ 4,264,971$ 3,770,297$
Cost of sales, including purchasing and warehousing costs 2,415,339 2,250,493 2,016,926
Gross profit 2,201,164 2,014,478 1,753,371
1,797,814 1,605,986 1,424,613
Operating income 403,350 408,492 328,758
Other, net:
Interest expense (35,992) (32,384) (20,069)
Gain (loss) on extinguishment of debt 986 - (3,230)
Other income, net 1,571 2,815 289
Total other, net (33,435) (29,569) (23,010)
Income from continuing operations before provision for
income taxes and loss on discontinued operations 369,915 378,923 305,748
Provision for income taxes 138,597 144,198 117,721
Income from continuing operations before loss on
discontinued operations 231,318 234,725 188,027
Discontinued operations:
Loss from operations of discontinued Wholesale
Dealer Network - - (63)
Benefit for income taxes - - (24)
Loss on discontinued operations - - (39)
Net income 231,318$ 234,725$ 187,988$
Net income per basic share from:
Income from continuing operations before loss on
discontinued operations
2.18$ 2.17$ 1.70$
Loss on discontinued operations
- - -
2.18$ 2.17$ 1.70$
Net income per diluted share from:
Income from continuing operations before loss on
discontinued operations
2.16$ 2.13$ 1.66$
Loss on discontinued operations
- - -
2.16$ 2.13$ 1.66$
Average common shares outstanding 106,129 108,318 110,846
Dilutive effect of stock options 995 1,669 2,376
Average common shares outstanding - assuming dilution 107,124 109,987 113,222
Fiscal Years Ended
Selling, general and administrative expenses
The accompanying notes to consolidated financial statements
are an integral part of these statements.
F-6