Advance Auto Parts 2006 Annual Report Download - page 41
Download and view the complete annual report
Please find page 41 of the 2006 Advance Auto Parts annual report below. You can navigate through the pages in the report by either clicking on the pages listed below, or by using the keyword search tool below to find specific information within the annual report.-
 1
1 -
2
-
3
-
4
-
5
-
6
-
7
-
8
-
9
-
10
-
11
-
12
-
13
-
14
-
15
-
16
-
17
-
18
-
19
-
20
-
21
-
22
-
23
-
24
-
25
-
26
-
27
-
28
-
29
-
30
-
 31
31 -
 32
32 -
 33
33 -
 34
34 -
 35
35 -
 36
36 -
 37
37 -
 38
38 -
 39
39 -
 40
40 -
 41
41 -
 42
42 -
 43
43 -
 44
44 -
 45
45 -
 46
46 -
 47
47 -
 48
48 -
 49
49 -
 50
50 -
 51
51 -
52
-
53
-
54
-
55
-
56
-
57
-
58
-
59
-
60
-
61
-
62
-
63
-
64
-
65
-
66
-
67
-
68
-
69
-
70
-
71
-
72
-
73
-
74
-
75
-
76
-
77
-
78
-
79
-
80
-
81
-
82
-
83
-
84
-
85
-
86
-
87
-
88
-
89
-
90
-
91
-
92
-
93
-
94
-
95
-
96
-
97
-
98
-
99
-
100
-
101
-
102
-
103
-
104
-
105
-
106
-
107
-
108
-
109
-
110
-
111
-
112
 |
 |

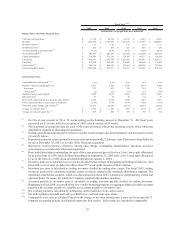
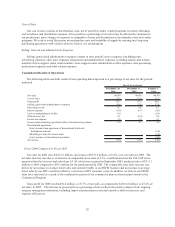
Condition and Results of Operations," and our consolidated financial statements and the related notes included elsewhere
in this report.
2006 2005 2004 2003 2002
Statement of Operations Data:
Net sales 4,616,503$ 4,264,971$ 3,770,297$ 3,493,696$ 3,204,140$
Cost of sales 2,415,339 2,250,493 2,016,926 1,889,178 1,769,733
Gross profit 2,201,164 2,014,478 1,753,371 1,604,518 1,434,407
Selling, general and administrative expenses
(3)
1,797,814 1,605,986 1,424,613 1,305,867 1,202,524
Expenses associated with merger related restructuring
(4)
- - - -
597
Expenses associated with merger and integration
(5)
- - -
10,417 34,935
Operating income 403,350 408,492 328,758 288,234 196,351
Interest expense (35,992) (32,384) (20,069) (37,576) (77,081)
Gain (loss) on extinguishment of debt 986
-
(3,230) (47,288) (16,822)
Expenses associated with secondary offering
- - - -
(1,733)
Other income, net 1,571 2,815 289 341 963
Income from continuing operations before
income taxes and (loss) income on
discontinued operations 369,915 378,923 305,748 203,711 101,678
Income tax expense 138,597 144,198 117,721 78,424 39,530
Income from continuing operations before
(loss) income on discontinued operations 231,318 234,725 188,027 125,287 62,148
Discontinued operations:
(Loss) income from operations of discontinued
Wholesale Distribution Network (including loss on
disposal of $2,693 in 2003)
- -
(63) (572) 4,691
(Benefit) provision for income taxes
- -
(24) (220) 1,820
(Loss) income on discontinued operations
- -
(39) (352) 2,871
Net income 231,318$ 234,725$ 187,988$ 124,935$ 65,019$
Per Share Data
(6)
:
Income from continuing operations before
(loss) income on discontinued operations
per basic share 2.18$ 2.17$ 1.70$ 1.15$ 0.59$
Income from continuing operations before
(loss) income on discontinued operations
per diluted share 2.16$ 2.13$ 1.66$ 1.12$ 0.57$
Net income per basic share 2.18$ 2.17$ 1.70$ 1.14$ 0.62$
Net income per diluted share 2.16$ 2.13$ 1.66$ 1.11$ 0.60$
Cash dividends declared per basic share 0.24$ -$ -$ -$ -$
Weighted average basic shares outstanding 106,129 108,318 110,846 109,499 105,147
Weighted average diluted shares outstanding 107,124 109,987 113,222 112,115 108,564
Cash flows provided by (used in):
Operating activities 333,604$ 321,632$ 260,397$ 355,921$ 242,996$
Investing activities (258,642) (302,780) (166,822) (85,474) (78,005)
Financing activities (104,617) (34,390) (48,741) (272,845) (169,223)
Fiscal Year
(1)(2)
(in thousands, except per share data)
18