Advance Auto Parts 2006 Annual Report Download - page 44
Download and view the complete annual report
Please find page 44 of the 2006 Advance Auto Parts annual report below. You can navigate through the pages in the report by either clicking on the pages listed below, or by using the keyword search tool below to find specific information within the annual report.-
 1
1 -
2
-
3
-
4
-
5
-
6
-
7
-
8
-
9
-
10
-
11
-
12
-
13
-
14
-
15
-
16
-
17
-
18
-
19
-
20
-
21
-
22
-
23
-
24
-
25
-
26
-
27
-
28
-
29
-
30
-
31
-
32
-
33
-
 34
34 -
 35
35 -
 36
36 -
 37
37 -
 38
38 -
 39
39 -
 40
40 -
 41
41 -
 42
42 -
 43
43 -
 44
44 -
 45
45 -
 46
46 -
 47
47 -
 48
48 -
 49
49 -
 50
50 -
 51
51 -
 52
52 -
 53
53 -
 54
54 -
55
-
56
-
57
-
58
-
59
-
60
-
61
-
62
-
63
-
64
-
65
-
66
-
67
-
68
-
69
-
70
-
71
-
72
-
73
-
74
-
75
-
76
-
77
-
78
-
79
-
80
-
81
-
82
-
83
-
84
-
85
-
86
-
87
-
88
-
89
-
90
-
91
-
92
-
93
-
94
-
95
-
96
-
97
-
98
-
99
-
100
-
101
-
102
-
103
-
104
-
105
-
106
-
107
-
108
-
109
-
110
-
111
-
112
 |
 |
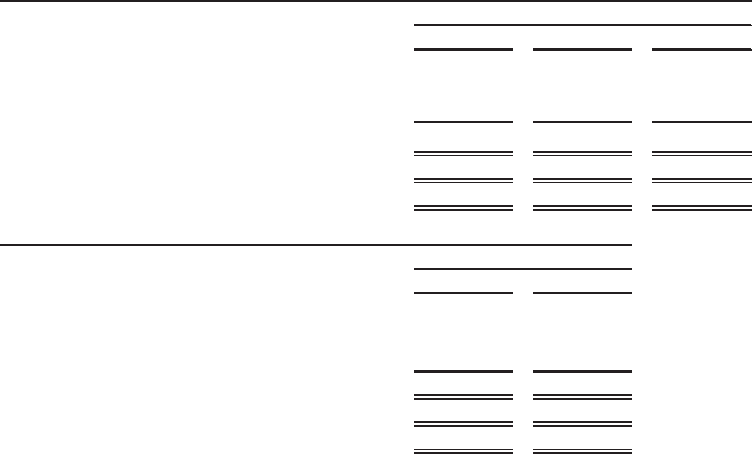
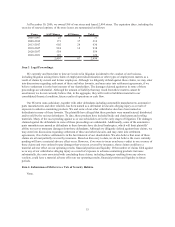
2006 2005 2004
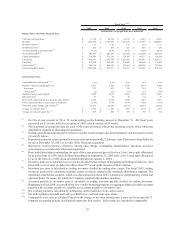
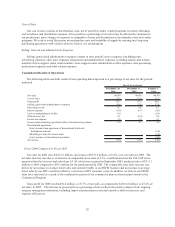
Number of stores at beginning of year 2,810 2,652 2,539
New stores 190 169 125
Closed stores (5) (11) (12)
Number of stores, end of period
(a)
2,995 2,810 2,652
Relocated stores 47 54 34
Stores with commercial delivery programs 2,439 2,192 1,945
2006 2005
Number of stores at beginning of year 62 -
New stores
(b)
25 62
Closed stores - -
Number of stores, end of period 87 62
Relocated stores - -
Stores with commercial delivery programs 87 62
Fiscal Year
AAP
Fiscal Year
AI
(a) Includes 2 and 7 stores not operating at December 30, 2006 and December 31, 2005, respectively, primarily due
to hurricane damage.
(b) Of the 62 new stores in 2005, 61 stores were acquired in September 2005 as a result of our AI acquisition.
We anticipate adding approximately 200 to 210 AAP and AI stores during 2007.
Management Overview
We recorded earnings per diluted share of $2.16 in fiscal 2006 compared to $2.13 for fiscal 2005. These results were
primarily driven by increased sales and higher gross margin dollars offset by an increase in certain fixed operating
expenses. Although sales did not meet our expectation for 2006, our average sales per store did reach the industry
leading level of $1.55 million per store. Additionally, our operating results for fiscal 2006 include the recognition of
$0.11 of share-based compensation expense per diluted share required by the adoption of Statement of Financial
Accounting Standard, or SFAS, No. 123 (revised 2004), "Share-Based Payment," or SFAS No. 123R, on January 1,
2006.
We believe the macroeconomic environment negatively impacted our business throughout much of 2006 and
resulted in weakening trends in our 2006 results compared to 2005. We believe our customers have been adversely
impacted by rising energy prices, higher insurance and interest rates, and larger required minimum payments on their
credit card balances, which limit their current ability to spend.
We have established a high priority of examining our operating expenses, including both corporate and store-
level, in light of our sales trends. We believe we can continue to be more efficient in our corporate-level expenses by
optimizing a number of job functions, examining discretionary expenses and re-evaluating all third party service
providers. Second, we continue to examine our non-sales activities in our stores and the impact of those activities on
our operating expenses due to the exponential impact that small changes can have on a large chain of stores such as
rolling out energy-management systems to a significant number of our stores. In addition, we are evaluating a
number of administrative procedures performed by our store team members in an effort to better optimize their time.
We believe our 2006 results do reflect the progress made on the following key initiatives that focus specifically on
driving higher sales per store:
xImproving store execution with a focus on customer service;
21