Advance Auto Parts 2006 Annual Report Download - page 53
Download and view the complete annual report
Please find page 53 of the 2006 Advance Auto Parts annual report below. You can navigate through the pages in the report by either clicking on the pages listed below, or by using the keyword search tool below to find specific information within the annual report.-
 1
1 -
2
-
3
-
4
-
5
-
6
-
7
-
8
-
9
-
10
-
11
-
12
-
13
-
14
-
15
-
16
-
17
-
18
-
19
-
20
-
21
-
22
-
23
-
24
-
25
-
26
-
27
-
28
-
29
-
30
-
31
-
32
-
33
-
34
-
35
-
36
-
37
-
38
-
39
-
40
-
41
-
42
-
 43
43 -
 44
44 -
 45
45 -
 46
46 -
 47
47 -
 48
48 -
 49
49 -
 50
50 -
 51
51 -
 52
52 -
 53
53 -
 54
54 -
 55
55 -
 56
56 -
 57
57 -
 58
58 -
 59
59 -
 60
60 -
 61
61 -
 62
62 -
 63
63 -
64
-
65
-
66
-
67
-
68
-
69
-
70
-
71
-
72
-
73
-
74
-
75
-
76
-
77
-
78
-
79
-
80
-
81
-
82
-
83
-
84
-
85
-
86
-
87
-
88
-
89
-
90
-
91
-
92
-
93
-
94
-
95
-
96
-
97
-
98
-
99
-
100
-
101
-
102
-
103
-
104
-
105
-
106
-
107
-
108
-
109
-
110
-
111
-
112
 |
 |

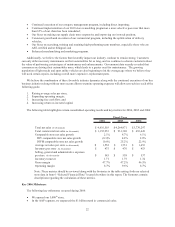
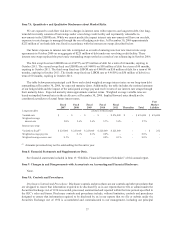
Quarterly Consolidated Financial Results (in thousands, except per share data)
16-Weeks 12-Weeks 12-Weeks 12-Weeks 16-Weeks 12-Weeks 12-Weeks 12-Weeks
Ended Ended Ended Ended Ended Ended Ended Ended
4/23/2005 7/16/2005 10/8/2005 12/31/2005 4/22/2006 7/15/2006 10/7/2006 12/30/2006
Net sales 1,258,364$ 1,023,146$ 1,019,736$ 963,725$ 1,393,010$ 1,107,857$ 1,099,486$ 1,016,150$
Gross profit 600,931 482,050 481,415 450,082 665,168 527,359 530,206 478,431
Net income 68,647$ 65,929$ 60,793$ 39,356$ 74,081$ 62,936$ 58,947$ 35,354$
Net income per share:
Basic
(1)
0.64$ 0.61$ 0.56$ 0.36$ 0.69$ 0.60$ 0.56$ 0.34$
Diluted
(1)
0.63$ 0.60$ 0.55$ 0.36$ 0.68$ 0.59$ 0.56$ 0.33$
(1) Amounts reflect the effect of a three-for-two stock split of our common stock distributed on September 23,
2005.
Liquidity and Capital Resources
Overview of Liquidity
Our primary cash requirements include the purchase of inventory, capital expenditures, payment of cash
dividends and contractual obligations. In addition, we have used available funds to repurchase shares of common
stock under our stock repurchase program and to pay quarterly cash dividends beginning in 2006. We have funded
these requirements primarily through cash generated from operations supplemented by borrowings under our credit
facilities as needed. We believe funds generated from our expected results of operations, available cash and cash
equivalents and available borrowings under our revolving credit facility will be sufficient to fund our primary
obligations for the next fiscal year.
At December 30, 2006, our cash and cash equivalents balance was $11.1 million, a decrease of $29.6 million
compared to fiscal year-end 2005. Our cash and cash equivalents balance decreased primarily due to the repurchase
of common stock, dividends paid to our shareholders and an overall net increase in working capital during 2006 as
compared to 2005. At December 30, 2006, we had outstanding indebtedness consisting of borrowings of $477.2
million under our revolving credit facility, an increase of $38.4 million from 2005. Additionally, we had $66.8
million in letters of credit outstanding, which reduced our cash availability under the revolving credit facility to
$206.4 million.
On February 15, 2006, our Board of Directors declared a quarterly cash dividend, the first in our history. We
paid quarterly dividends of $0.06 per share to stockholders of record for each of our quarters during 2006.
Subsequent to December 30, 2006, our Board of Directors declared a quarterly dividend of $0.06 per share to be
paid on April 6, 2007 to all common stockholders of record as of March 23, 2007.
Capital Expenditures
Our primary capital requirements have been the funding of our continued store expansion program, including
new store openings and store acquisitions, store relocations and remodels, inventory requirements, the construction
and upgrading of distribution centers, the development and implementation of proprietary information systems and
our acquisitions.
Our capital expenditures were $258.6 million in 2006. These amounts included costs related to new store
openings, the upgrade of our information systems and remodels and relocations of existing stores. During fiscal
2006, we opened 215 AAP and AI stores, remodeled 189 AAP stores and relocated 47 AAP stores. In addition, we
also made a $12.5 million contingent payment in 2006 related to the acquisition of Autopart International.
Our future capital requirements will depend in large part on the number of and timing for new stores we open or
acquire within a given year and the number of stores we relocate or remodel. During 2007, we anticipate adding 200
to 210 new AAP and AI stores, remodeling 150 AAP stores and relocating 35 AAP stores. Our new AAP stores, if
30