Advance Auto Parts 2006 Annual Report Download - page 51
Download and view the complete annual report
Please find page 51 of the 2006 Advance Auto Parts annual report below. You can navigate through the pages in the report by either clicking on the pages listed below, or by using the keyword search tool below to find specific information within the annual report.-
 1
1 -
2
-
3
-
4
-
5
-
6
-
7
-
8
-
9
-
10
-
11
-
12
-
13
-
14
-
15
-
16
-
17
-
18
-
19
-
20
-
21
-
22
-
23
-
24
-
25
-
26
-
27
-
28
-
29
-
30
-
31
-
32
-
33
-
34
-
35
-
36
-
37
-
38
-
39
-
40
-
 41
41 -
 42
42 -
 43
43 -
 44
44 -
 45
45 -
 46
46 -
 47
47 -
 48
48 -
 49
49 -
 50
50 -
 51
51 -
 52
52 -
 53
53 -
 54
54 -
 55
55 -
 56
56 -
 57
57 -
 58
58 -
 59
59 -
 60
60 -
 61
61 -
62
-
63
-
64
-
65
-
66
-
67
-
68
-
69
-
70
-
71
-
72
-
73
-
74
-
75
-
76
-
77
-
78
-
79
-
80
-
81
-
82
-
83
-
84
-
85
-
86
-
87
-
88
-
89
-
90
-
91
-
92
-
93
-
94
-
95
-
96
-
97
-
98
-
99
-
100
-
101
-
102
-
103
-
104
-
105
-
106
-
107
-
108
-
109
-
110
-
111
-
112
 |
 |
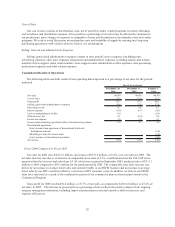
Cost of Sales
Our cost of sales consists of merchandise costs, net of incentives under vendor programs, inventory shrinkage
and warehouse and distribution expenses. Gross profit as a percentage of net sales may be affected by variations in
our product mix, price changes in response to competitive factors and fluctuations in merchandise costs and vendor
programs. We seek to avoid fluctuation in merchandise costs and instability of supply by entering into long-term
purchasing agreements with vendors when we believe it is advantageous.
Selling, General and Administrative Expenses
Selling, general and administrative expenses consist of store payroll, store occupancy (including rent),
advertising expenses, other store expenses and general and administrative expenses, including salaries and related
benefits of store support center team members, store support center administrative office expenses, data processing,
professional expenses and other related expenses.
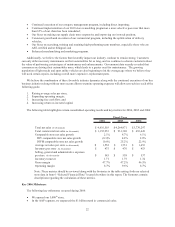
Consolidated Results of Operations
The following table sets forth certain of our operating data expressed as a percentage of net sales for the periods
indicated.
December 30, December 31, January 1,
2006 2005 2005
Net sales 100.0% 100.0% 100.0%
Cost of sales 52.3 52.8 53.5
Gross profit 47.7 47.2 46.5
Selling, general and administrative expenses 39.0 37.6 37.8
Operating income 8.7 9.6 8.7
Interest expense (0.8) (0.7) (0.5)
Loss on extinguishment of debt 0.0 - (0.1)
Other income, net 0.1 (0.0) 0.0
Income tax expense 3.0 3.4 3.1
Income from continuing operations before discontinued operations 5.0 5.5 5.0
Discontinued operations:
(Loss) income from operations of discontinued wholesale
distribution network - - (0.0)
(Benefit) provision for income taxes - - (0.0)
(Loss) income on discontinued operations - - (0.0)
Net income 5.0% 5.5% 5.0%
Fiscal Year Ended
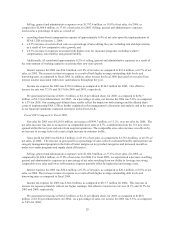
Fiscal 2006 Compared to Fiscal 2005
Net sales for 2006 were $4,616.5 million, an increase of $351.5 million, or 8.2%, over net sales for 2005. The
net sales increase was due to an increase in comparable store sales of 2.1%, contributions from the 190 AAP stores
opened within the last year and sales from AI. AI, which was acquired in September 2005, produced sales of $111.1
million in 2006 compared to $30.3 million for the partial period in 2005. The comparable store sales increase was
driven by an increase in average ticket sales and customer traffic in our DIFM business and an increase in average
ticket sales by our DIY customers offset by a decrease in DIY customer count. In addition, we believe our DIFM
sales have increased as a result of the continued execution of our commercial plan as discussed previously in the
Commercial Program.
Gross profit for 2006 was $2,201.2 million, or 47.7% of net sales, as compared to $2,014.5 million, or 47.2% of
net sales, in 2005. The increase in gross profit as a percentage of sales reflects the positive impact of our ongoing
category management initiatives, including improved procurement costs and a positive shift in sales mix, and
logistics efficiencies.
28