Advance Auto Parts 2006 Annual Report Download - page 7
Download and view the complete annual report
Please find page 7 of the 2006 Advance Auto Parts annual report below. You can navigate through the pages in the report by either clicking on the pages listed below, or by using the keyword search tool below to find specific information within the annual report.-
 1
1 -
 2
2 -
 3
3 -
 4
4 -
 5
5 -
 6
6 -
 7
7 -
 8
8 -
 9
9 -
 10
10 -
 11
11 -
 12
12 -
 13
13 -
 14
14 -
 15
15 -
 16
16 -
 17
17 -
 18
18 -
19
-
20
-
21
-
22
-
23
-
24
-
25
-
26
-
27
-
28
-
29
-
30
-
31
-
32
-
33
-
34
-
35
-
36
-
37
-
38
-
39
-
40
-
41
-
42
-
43
-
44
-
45
-
46
-
47
-
48
-
49
-
50
-
51
-
52
-
53
-
54
-
55
-
56
-
57
-
58
-
59
-
60
-
61
-
62
-
63
-
64
-
65
-
66
-
67
-
68
-
69
-
70
-
71
-
72
-
73
-
74
-
75
-
76
-
77
-
78
-
79
-
80
-
81
-
82
-
83
-
84
-
85
-
86
-
87
-
88
-
89
-
90
-
91
-
92
-
93
-
94
-
95
-
96
-
97
-
98
-
99
-
100
-
101
-
102
-
103
-
104
-
105
-
106
-
107
-
108
-
109
-
110
-
111
-
112
 |
 |

Advance Auto Parts, Inc.
▲
Annual Report 2006
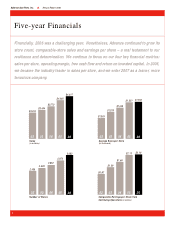
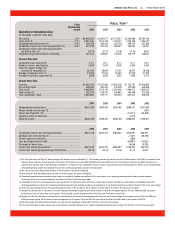
5
FISCAL YEAR
(1)
2006 2005 2004 2003 2002
Comparable operating income .............................................................
$403,350
$408,492 $328,758 $289,441 $231,883
Merger related restructuring (10) ........................................................
-
- - - (597)
Merger and integration (10) .................................................................
-
- - (10,417) (34,935)
Operations effect on 53rd week ............................................................
-
- - 9,210 -
Operating income .................................................................................
$403,350
$408,492 $328,758 $288,234 $196,351
2006 2005 2004 2003 2002
Comparable income from continuing operations.................................
$231,318
$234,725 $188,027 $155,091 $94,267
Add back items from footnote (4) .......................................................
-
- - (1,207) (35,532)
Interest expense in 53rd week..............................................................
-
- - (368) -
Loss on extinguishment of debt...........................................................
-
- - (46,887) (16,822)
Tax impact of above items....................................................................
-
- - 18,658 20,235
Income from continuing operations.....................................................
$231,318
$234,725 $188,027 $125,287 $62,148
Income from continuing operations per diluted share ........................
$2.16
$2.13 $1.66 $1.12 $0.57
(1) Our fiscal year consists of 52 or 53 weeks ending on the Saturday nearest to December 31. The Company excluded the operating results of the 53rd week in fiscal 2003 as reconciled in the
footnotes below; therefore, all fiscal years presented consist of 52 weeks. Fiscal years 2002 and 2003 include non-GAAP measures. The Company used these non-GAAP measures as an
indication of its earnings from its core operations and believes it is important to our stockholders due to the nature and significance of the excluded expenses. Please see our reconciliation of
comparable operating income and comparable income from continuing operations included in the table above.
(2) Net sales for fiscal year 2003 exclude the effect of the 53rd week in the amount of $63,016.
(3) Gross profit for fiscal year 2003 excludes the effect of the 53rd week in the amount of $28,762.
(4) Comparable operating income excludes certain charges as included in the above reconciliation of this measurement to our operating income presented under generally accepted
accounting policies in our financial statements contained in the Form 10-K of this annual report.
(5) Comparable income from continuing operations excludes the items in footnote (4) above and the early extinguishment of debt. The above is a reconciliation of comparable income from
continuing operations to income from continuing operations presented under generally accepted accounting policies in our financial statements contained in the Form 10-K of this annual report.
(6) Total store square footage excludes the square footage of the stores in the AI segment. The AI segment is further defined in the Form 10-K of this annual report.
(7) Average net sales per store is calculated as net sales divided by the average of beginning and ending number of stores for the respective period. The fiscal 2006 and 2005 calculations
exclude the net sales and stores from the AI segment. The fiscal 2003 net sales exclude the effect of the 53rd week in the amount of $63,016.
(8) Average net sales per square foot is calculated as net sales divided by the average of the beginning and ending total store square footage for the respective period. The fiscal 2006 and
2005 calculations exclude the net sales and square footage from the AI segment. The fiscal 2003 net sales exclude the effect of the 53rd week in the amount of $63,016.
(9) Net debt includes total debt and bank overdrafts, less cash and cash equivalents as presented in the Form 10-K of this annual report.
(10) For more information on these charges refer to the footnotes to the table setting forth our “Selected Consolidated Financial Data” on page 19 in the Form 10-K of this annual report.
5-Year
Compounded
Growth 2006 2005 2004 2003 2002
Statement of Operations Data:
(in thousands, except per share data)
Net sales(2) .................................................................................9.6%
$4,616,503
$4,264,971 $3,770,297 $3,430,680 $3,204,140
Gross profit (3) .........................................................................11.3%
2,201,164
2,014,478 1,753,371 1,575,756 1,434,407
Comparable operating income (4) ............................................14.8%
403,350
408,492 328,758 289,441 231,883
Comparable income from continuing operations (5) ................25.2%
231,318
234,725 188,027 155,091 94,267
Comparable income from continuing operations
per diluted share (5).........................................................................
$2.16
$2.13 $1.66 $1.39 $0.87
Weighted average diluted shares outstanding .....................................
107,124
109,987 113,222 112,115 108,564
Selected Store Data:
Comparable store sales growth … … … … … … … … … … … … . ........
2.1%
8.7% 6.1% 3.1% 5.5%
Number of stores, end of period… … … … … … … … … … … … .........
3,082
2,872 2,652 2,539 2,435
Total store square footage, end
of period (in thousands) (6)… … … … … … … … … … … … … ... ....
22,235
20,899 19,734 18,875 18,108
Average net sales per store (7).............................................................
$1,552
$1,551 $1,453 $1,379 $1,303
Average net sales per square foot (8) ..................................................
$209
$208 $195 $186 $174
Balance Sheet Data:
Inventory...............................................................................................
$1,463,340
$1,367,099 $1,201,450 $1,113,781 $1,048,803
Net working capital …… … … … … … … … … … … … … … … … ........
498,553
406,476 416,302 372,509 462,896
Total assets……… … … … … … … … … … … … … … … … … … .........
2,682,681
2,542,149 2,201,962 1,983,071 1,965,225
Total net debt (9) ………… … … … … … … … … … … … … … … .......
500,318
448,187 433,863 464,598 722,506
Total stockholders' equity … … … … … … … … … … … … … … .. ........
1,030,854
919,771 722,315 631,244 468,356