Advance Auto Parts 2006 Annual Report Download - page 55
Download and view the complete annual report
Please find page 55 of the 2006 Advance Auto Parts annual report below. You can navigate through the pages in the report by either clicking on the pages listed below, or by using the keyword search tool below to find specific information within the annual report.-
 1
1 -
2
-
3
-
4
-
5
-
6
-
7
-
8
-
9
-
10
-
11
-
12
-
13
-
14
-
15
-
16
-
17
-
18
-
19
-
20
-
21
-
22
-
23
-
24
-
25
-
26
-
27
-
28
-
29
-
30
-
31
-
32
-
33
-
34
-
35
-
36
-
37
-
38
-
39
-
40
-
41
-
42
-
43
-
44
-
 45
45 -
 46
46 -
 47
47 -
 48
48 -
 49
49 -
 50
50 -
 51
51 -
 52
52 -
 53
53 -
 54
54 -
 55
55 -
 56
56 -
 57
57 -
 58
58 -
 59
59 -
 60
60 -
 61
61 -
 62
62 -
 63
63 -
 64
64 -
 65
65 -
66
-
67
-
68
-
69
-
70
-
71
-
72
-
73
-
74
-
75
-
76
-
77
-
78
-
79
-
80
-
81
-
82
-
83
-
84
-
85
-
86
-
87
-
88
-
89
-
90
-
91
-
92
-
93
-
94
-
95
-
96
-
97
-
98
-
99
-
100
-
101
-
102
-
103
-
104
-
105
-
106
-
107
-
108
-
109
-
110
-
111
-
112
 |
 |

benefits and control costs. Any changes in the plan or revisions to assumptions that affect the amount of expected
future benefits may have a significant impact on the amount of the reported obligation and annual expense.
Effective second quarter of 2004, we amended the postretirement plan to exclude outpatient prescription drug
benefits to Medicare eligible retirees effective January 1, 2006. Due to this negative plan amendment, our
accumulated postretirement benefit obligation was reduced by $7.6 million, resulting in an unrecognized negative
prior service cost in the same amount. The unrecognized negative prior service cost is being amortized over the 13-
year estimated remaining life expectancy of the plan participants.
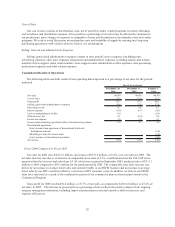
Analysis of Cash Flows
An analysis of our cash flows for fiscal 2006, 2005 and 2004 is included below.
(in millions) 2006 2005 2004
Cash flows from operating activities 333.6$ 321.6$ 260.4$
Cash flows from investing activities (258.6) (302.8) (166.8)
Cash flows from financing activities (104.6) (34.3) (48.8)
Net (decrease) increase in cash and
cash equivalents (29.6)$ (15.5)$ 44.8$
Fiscal Year
Operating Activities
For fiscal 2006, net cash provided by operating activities increased $12.0 million to $333.6 million. Significant
components of this increase consisted of:
x$15.2 million increase in earnings exclusive of $18.7 million of incremental, non-cash, share-based
compensation expense compared to the same period in fiscal 2005;
x$19.5 million increase in depreciation and amortization;
x$24.1 million decrease in cash inflows primarily related to the sale of our private label credit card portfolio
in fiscal 2005;
x$24.9 million reduction in cash outflows, net of accounts payable, as a result of reducing inventory growth
rates in line with our current sales trend;
x$33.4 million increase in cash flows from other assets related to the timing of payments for normal
operating expenses, primarily our monthly rent
x$17.5 million decrease in cash inflows relating to the timing of accrued operating expenses; and
x$30.3 million decrease in cash flows from tax benefits related to exercise of stock options.
For fiscal 2005, net cash provided by operating activities increased $61.2 million to $321.6 million. Significant
components of this increase consisted of:
x$61.8 million increase from higher net income before the non-cash impact of depreciation and amortization
over fiscal 2004;
x$37.8 million increase in cash flow, primarily resulting from the reduction in trade receivables upon the
sale of our private label credit card portfolio;
x$42.8 million decrease as a result of higher inventory levels needed for our Northeast distribution center
and expansion of the number of stores which carry an extended mix of parts;
x$25.7 million increase in other assets primarily due to timing in the payment of our monthly rent;
x$15.9 million increase in accounts payable reflective of the increase in inventory discussed above; and
x$20.2 million increase in accrued expenses related to the timing of payments for normal operating
expenses.
32