Advance Auto Parts 2006 Annual Report Download - page 6
Download and view the complete annual report
Please find page 6 of the 2006 Advance Auto Parts annual report below. You can navigate through the pages in the report by either clicking on the pages listed below, or by using the keyword search tool below to find specific information within the annual report.-
 1
1 -
 2
2 -
 3
3 -
 4
4 -
 5
5 -
 6
6 -
 7
7 -
 8
8 -
 9
9 -
 10
10 -
 11
11 -
 12
12 -
 13
13 -
 14
14 -
 15
15 -
 16
16 -
 17
17 -
18
-
19
-
20
-
21
-
22
-
23
-
24
-
25
-
26
-
27
-
28
-
29
-
30
-
31
-
32
-
33
-
34
-
35
-
36
-
37
-
38
-
39
-
40
-
41
-
42
-
43
-
44
-
45
-
46
-
47
-
48
-
49
-
50
-
51
-
52
-
53
-
54
-
55
-
56
-
57
-
58
-
59
-
60
-
61
-
62
-
63
-
64
-
65
-
66
-
67
-
68
-
69
-
70
-
71
-
72
-
73
-
74
-
75
-
76
-
77
-
78
-
79
-
80
-
81
-
82
-
83
-
84
-
85
-
86
-
87
-
88
-
89
-
90
-
91
-
92
-
93
-
94
-
95
-
96
-
97
-
98
-
99
-
100
-
101
-
102
-
103
-
104
-
105
-
106
-
107
-
108
-
109
-
110
-
111
-
112
 |
 |

Advance Auto Parts, Inc.
▲
Annual Report 2006
4
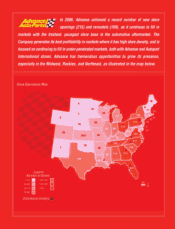
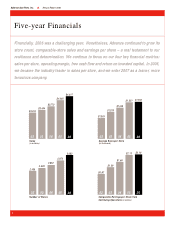
Five-year Financials
Financially, 2006 was a challenging year. Nonetheless, Advance continued to grow its
store count, comparable-store sales and earnings per share – a real testament to our
resilience and determination. We continue to focus on our four key financial metrics:
sales per store, operating margin, free cash flow and return on invested capital. In 2006,
we became the industry leader in sales per store, and we enter 2007 as a leaner, more
tenacious company.
02 03 04 05
$3,204 $3,494
$3,770
$4,265
Sales
(in millions)
02 03 04 05
$0.87
$1.39
$1.66
$2.13
Comparable Earnings per Share from
Continuing Operations
(in dollars)
02 03 04 05
$1,303
$1,379
$1,453
$1,551
Average Sales per Store
(in thousands)
06
$4,617
06
$1,552
06
$2.16
02 03 04 05
2,435 2,539 2,652
2,872
Number of Stores
06
3,082