Advance Auto Parts 2006 Annual Report Download - page 45
Download and view the complete annual report
Please find page 45 of the 2006 Advance Auto Parts annual report below. You can navigate through the pages in the report by either clicking on the pages listed below, or by using the keyword search tool below to find specific information within the annual report.-
 1
1 -
2
-
3
-
4
-
5
-
6
-
7
-
8
-
9
-
10
-
11
-
12
-
13
-
14
-
15
-
16
-
17
-
18
-
19
-
20
-
21
-
22
-
23
-
24
-
25
-
26
-
27
-
28
-
29
-
30
-
31
-
32
-
33
-
34
-
 35
35 -
 36
36 -
 37
37 -
 38
38 -
 39
39 -
 40
40 -
 41
41 -
 42
42 -
 43
43 -
 44
44 -
 45
45 -
 46
46 -
 47
47 -
 48
48 -
 49
49 -
 50
50 -
 51
51 -
 52
52 -
 53
53 -
 54
54 -
 55
55 -
56
-
57
-
58
-
59
-
60
-
61
-
62
-
63
-
64
-
65
-
66
-
67
-
68
-
69
-
70
-
71
-
72
-
73
-
74
-
75
-
76
-
77
-
78
-
79
-
80
-
81
-
82
-
83
-
84
-
85
-
86
-
87
-
88
-
89
-
90
-
91
-
92
-
93
-
94
-
95
-
96
-
97
-
98
-
99
-
100
-
101
-
102
-
103
-
104
-
105
-
106
-
107
-
108
-
109
-
110
-
111
-
112
 |
 |

xContinued execution of our category management program, including direct importing;
xContinued implementation of our 2010 store remodeling program at a more selective pace now that more
than 65% of our chain has been remodeled;
xOur focus on making our supply chain more responsive and improving our in-stock position;
xConsistent growth and execution of our commercial program, including the optimization of delivery
vehicles;
xOur focus on recruiting, training and retaining high-performing team members, especially those who are
ASE certified and/or bilingual; and
xEnhanced merchandising and marketing programs.
Additionally, we believe the factors that favorably impact our industry continue to remain strong. Customers
can only defer necessary maintenance on their automobiles for so long, and we continue to educate customers about
the value of performing certain types of maintenance and enhancements. Government data recently revealed that
consumers are driving their automobiles more, which leads to a greater need for maintenance. The growing
population of light trucks and sport utility vehicles are also beginning to hit the average age where we believe they
will need certain repairs, including overall more expensive, replacement parts.
We believe the combination of these favorable industry dynamics along with the continued execution of our key
business initiatives along with our more recent effort to examine operating expenses will allow us to achieve each of the
following goals:
1. Raising average sales per store;
2. Expanding operating margin;
3. Increasing free cash flow; and
4. Increasing return on invested capital.
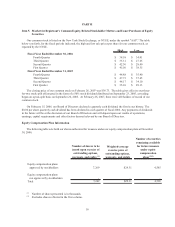
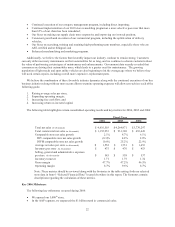
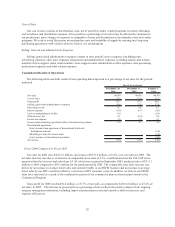
The following table highlights certain consolidated operating results and key metrics for 2006, 2005 and 2004:
2006 2005 2004
Total net sales
(in thousands)
4,616,503$ 4,264,971$ 3,770,297$
Total commercial net sales
(in thousands)
1,155,953$ 931,320$ 693,449$
Comparable store net sales growth 2.1% 8.7% 6.1%
DIY comparable store net sales growth (0.3)% 4.8% 2.8%
DIFM comparable store net sales growth 10.8% 25.2% 22.9%
Average net sales per store
(in thousands)
1,552$ 1,551$ 1,453$
Inventory per store
(in thousands)
475$ 476$ 453$
Selling, general and administrative expenses
per store
(in thousands)
583$ 559$ 537$
Inventory turnover 1.71 1.75 1.74
Gross margin 47.7% 47.2% 46.5%
Operating margin 8.7% 9.6% 8.7%
Fiscal Year
Note: These metrics should be reviewed along with the footnotes to the table setting forth our selected
store data in Item 6 “Selected Financial Data” located elsewhere in this report. The footnotes contain
descriptions regarding the calculation of these metrics.
Key 2006 Milestones
The following key milestones occurred during 2006:
xWe opened our 3,000th store;
xIn the AAP segment, we surpassed the $1 billion mark in commercial sales;
22