Advance Auto Parts 2006 Annual Report Download - page 43
Download and view the complete annual report
Please find page 43 of the 2006 Advance Auto Parts annual report below. You can navigate through the pages in the report by either clicking on the pages listed below, or by using the keyword search tool below to find specific information within the annual report.-
 1
1 -
2
-
3
-
4
-
5
-
6
-
7
-
8
-
9
-
10
-
11
-
12
-
13
-
14
-
15
-
16
-
17
-
18
-
19
-
20
-
21
-
22
-
23
-
24
-
25
-
26
-
27
-
28
-
29
-
30
-
31
-
32
-
 33
33 -
 34
34 -
 35
35 -
 36
36 -
 37
37 -
 38
38 -
 39
39 -
 40
40 -
 41
41 -
 42
42 -
 43
43 -
 44
44 -
 45
45 -
 46
46 -
 47
47 -
 48
48 -
 49
49 -
 50
50 -
 51
51 -
 52
52 -
 53
53 -
54
-
55
-
56
-
57
-
58
-
59
-
60
-
61
-
62
-
63
-
64
-
65
-
66
-
67
-
68
-
69
-
70
-
71
-
72
-
73
-
74
-
75
-
76
-
77
-
78
-
79
-
80
-
81
-
82
-
83
-
84
-
85
-
86
-
87
-
88
-
89
-
90
-
91
-
92
-
93
-
94
-
95
-
96
-
97
-
98
-
99
-
100
-
101
-
102
-
103
-
104
-
105
-
106
-
107
-
108
-
109
-
110
-
111
-
112
 |
 |
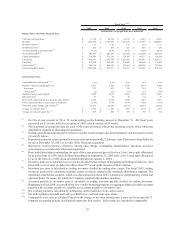
store sales from the original date of opening. We do not include net sales from the 37 Western Auto retail
stores in our comparable store calculation as a result of their unique product offerings, including automotive
service and tires. We also exclude the net sales from the AI stores from our comparable store sales. In 2003,
the comparable store sales calculation included sales from our 53rd week compared to our first week of
operation in 2003 (the comparable calendar week). In 2004, as a result of the 53rd week in 2003, the
comparable store sales calculation excluded week one of sales from 2003.
(13) Closed stores in 2002 include 133 stores closed as part of the integration of the Discount operations.
(14) Total store square footage excludes the square footage of the stores in the AI segment.
(15) Average net sales per store is calculated as net sales divided by the average of beginning and ending number of
stores for the respective period. The fiscal 2006 and 2005 calculation excludes the net sales and stores from the AI
segment. The fiscal 2003 net sales exclude the effect of the 53rd week in the amount of $63.0 million.
(16) Average net sales per square foot is calculated as net sales divided by the average of the beginning and ending total
store square footage for the respective period. The fiscal 2006 and 2005 calculation excludes the net sales and
square footage from the AI segment. The fiscal 2003 net sales exclude the effect of the 53rd week in the amount of
$63.0 million.
Item 7. Management's Discussion and Analysis of Financial Condition and Results of Operations.
The following discussion and analysis of financial condition and results of operations should be read in
conjunction with "Selected Financial Data," our consolidated historical financial statements and the notes to those
statements that appear elsewhere in this report. Our discussion contains forward-looking statements based upon
current expectations that involve risks and uncertainties, such as our plans, objectives, expectations and intentions.
Actual results and the timing of events could differ materially from those anticipated in these forward-looking
statements as a result of a number of factors, including those set forth under “Forward Looking Statements” and
"Risk Factors" elsewhere in this report.
Our fiscal year ends on the Saturday nearest December 31 of each year, which results in an extra week every
six years (our next 53-week fiscal year is 2009). Our first quarter consists of 16 weeks, and the other three quarters
consist of 12 weeks.
Introduction
We primarily operate within the United States automotive aftermarket industry, which includes replacement
parts (excluding tires), accessories, maintenance items, batteries and automotive chemicals for cars and light trucks
(pickup trucks, vans, minivans and sport utility vehicles). We currently are the second largest specialty retailer of
automotive parts, accessories and maintenance items to “do-it-yourself,” or DIY, customers in the United States,
based on store count and sales. At December 30, 2006, we operated 3,082 stores throughout 40 states.
We operate in two reportable segments: Advance Auto Parts, or AAP, and Autopart International, or AI. The
AAP segment is comprised of our store operations within the United States, Puerto Rico and the Virgin Islands
which operate under the trade names “Advance Auto Parts,” “Discount Advance Auto Parts” and “Western Auto.”
At December 30, 2006, we operated 2,995 stores in the AAP segment, of which 2,958 stores operated under the
trade names “Advance Auto Parts” and “Discount Advance Auto Parts” throughout 40 states in the Northeastern,
Southeastern and Midwestern regions of the United States. These stores offer automotive replacement parts,
accessories and maintenance items, with no significant concentration in any specific product area. In addition, we
operated 37 stores under the “Western Auto” and “Advance Auto Parts” trade names, located primarily in Puerto
Rico and the Virgin Islands. The Western Auto stores offer automotive tires and service in addition to automotive
parts, accessories and maintenance items.
At December 30, 2006, we operated 87 stores in the AI segment under the “Autopart International” trade name.
We acquired AI in September 2005, and AI operates as an independent, wholly-owned subsidiary. AI’s business
primarily serves the commercial market from its store locations. In addition, its North American Sales Division
services warehouse distributors and jobbers throughout North America.
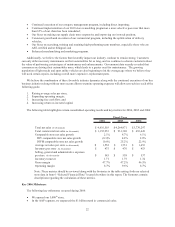
The following table sets forth the total number of new, closed and relocated stores and stores with commercial
delivery programs during fiscal 2006, 2005 and 2004. We lease approximately 80% of our stores.
20