Singapore Airlines 2005 Annual Report Download - page 88
Download and view the complete annual report
Please find page 88 of the 2005 Singapore Airlines annual report below. You can navigate through the pages in the report by either clicking on the pages listed below, or by using the keyword search tool below to find specific information within the annual report.-
 1
1 -
2
-
3
-
4
-
5
-
6
-
7
-
8
-
9
-
10
-
11
-
12
-
13
-
14
-
15
-
16
-
17
-
18
-
19
-
20
-
21
-
22
-
23
-
24
-
25
-
26
-
27
-
28
-
29
-
30
-
31
-
32
-
33
-
34
-
35
-
36
-
37
-
38
-
39
-
40
-
41
-
42
-
43
-
44
-
45
-
46
-
47
-
48
-
49
-
50
-
51
-
52
-
53
-
54
-
55
-
56
-
57
-
58
-
59
-
60
-
61
-
62
-
63
-
64
-
65
-
66
-
67
-
68
-
69
-
70
-
71
-
72
-
73
-
74
-
75
-
76
-
77
-
 78
78 -
 79
79 -
 80
80 -
 81
81 -
 82
82 -
 83
83 -
 84
84 -
 85
85 -
 86
86 -
 87
87 -
 88
88 -
 89
89 -
 90
90 -
 91
91 -
 92
92 -
 93
93 -
 94
94 -
 95
95 -
 96
96 -
 97
97 -
 98
98 -
99
-
100
-
101
-
102
-
103
-
104
-
105
-
106
-
107
-
108
-
109
-
110
-
111
-
112
-
113
-
114
-
115
-
116
-
117
-
118
-
119
-
120
-
121
-
122
-
123
-
124
-
125
-
126
-
127
-
128
 |
 |

86 SIA Annual Report 04/05
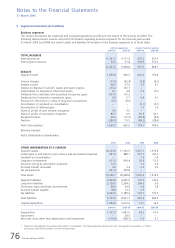
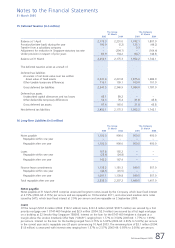
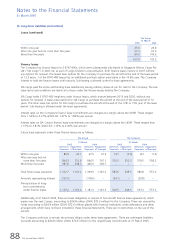
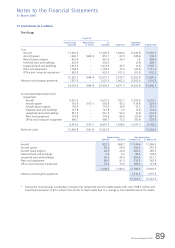
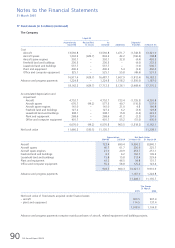
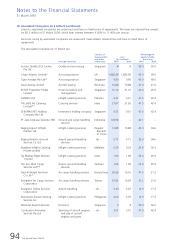
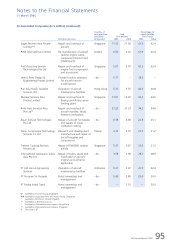
Notes to the Financial Statements
31 March 2005
CC
MOD: CN1323
M Y
C K
While every effort has been taken to carry out instruction to customers satisfaction
NO RESPONSIBILITY liablilty will be accepted for errors
CUSTOMERS ARE THEREFOREURGED TO CHECK THOROUGHLY BEFORE
AUTHORISING PRINTRUNS
DALIM
1 2 3 4 5 6 7 8 9 10 OK TS
CC196777 DLMAC13 10.06.2005 150#
13col
13 Share Capital (in $ million) (continued)
Share option plans (continued)
SIAEC ESOP
Exercisable period Exercise price* Number outstanding Number exercisable
––––––––––––––––––––––––––––––––––––––––––––––––––––––––––––––––––––––––––––––––––––––––––––––––––––––––––––––––––––––––––––––––––––––––––––––––––
28.3.2001 - 27.3.2010 $1.85 298,500 298,500
28.3.2002 - 27.3.2010 $1.85 10,690,000 10,690,000
28.3.2003 - 27.3.2010 $1.85 298,500 298,500
28.3.2004 - 27.3.2010 $1.85 298,500 298,500
3.7.2001 - 2.7.2010 $1.75 502,486 502,486
3.7.2002 - 2.7.2010 $1.75 7,910,188 7,910,188
3.7.2003 - 2.7.2010 $1.75 502,486 502,486
3.7.2004 - 2.7.2010 $1.75 502,490 502,490
2.7.2002 - 1.7.2011 $1.21 446,375 446,375
2.7.2003 - 1.7.2011 $1.21 3,064,925 3,064,925
2.7.2004 - 1.7.2011 $1.21 512,100 512,100
2.7.2005 - 1.7.2011 $1.21 767,600 –
1.7.2003 - 30.6.2012 $2.18 840,700 840,700
1.7.2004 - 30.6.2012 $2.18 12,907,700 12,907,700
1.7.2005 - 30.6.2012 $2.18 840,700 –
1.7.2006 - 30.6.2012 $2.18 840,700 –
1.7.2004 - 30.6.2013 $1.55 298,575 298,575
1.7.2005 - 30.6.2013 $1.55 6,343,250 –
1.7.2006 - 30.6.2013 $1.55 324,250 –
1.7.2007 - 30.6.2013 $1.55 324,250 –
1.7.2005 - 30.6.2014 $1.89 620,125 –
1.7.2006 - 30.6.2014 $1.89 13,335,125 –
1.7.2007 - 30.6.2014 $1.89 620,125 –
1.7.2008 - 30.6.2014 $1.89 620,125 –
–––––––––––––––––––––––––––––––––––––––––––––
Total number of options outstanding 63,709,775 @ 39,073,525
–––––––––––––––––––––––––––––––––––––––––––––
* At the extraordinary general meeting of SIAEC held on 26 July 2004, SIAEC’s shareholders approved an amendment
to the Plan allowing for adjustment to the exercise prices of the existing options by SIAEC Committee administering
the Plan, in the event of the declaration of a special dividend. At the same meeting, SIAEC’s shareholders approved
the declaration of a special dividend. The said Committee then approved a $0.20 reduction of the exercise prices of
the outstanding share options. The exercise prices reflected here are the exercise prices after such adjustment.
@ The total number of options outstanding includes 4,193,775 share options not exercised by employees who have
retired or ceased to be employed by SIAEC or any of its subsidiary companies by reason of (i) ill health, injury
or disability or death; (ii) redundancy; or (iii) any other reason approved in writing by the Compensation and HR
Committee. The said options are exercisable up to the expiration of the applicable exercise period or the period of
5 years from the date of retirement or cessation of employment, whichever is earlier.
14 Deferred Account (in $ million)
The Group The Company
31 March 31 March
2005 2004 2005 2004
––––––––––––––––––––––––––––––––––––––––––––––––––––––––––––––––––––––––––––––––––––––––––––––––––––––––––––––––––––––––––––––––––––––––––––––––––
Deferred gain on sale and leaseback transactions
– operating leases 362.9 391.3 356.8 391.2
– finance leases 51.7 55.4 – –
–––––––––––––––––––––––––––––––––––––––––––––––––––––––––––––––––––––
414.6 446.7 356.8 391.2
–––––––––––––––––––––––––––––––––––––––––––––––––––––––––––––––––––––