Singapore Airlines 2005 Annual Report Download - page 46
Download and view the complete annual report
Please find page 46 of the 2005 Singapore Airlines annual report below. You can navigate through the pages in the report by either clicking on the pages listed below, or by using the keyword search tool below to find specific information within the annual report.-
 1
1 -
2
-
3
-
4
-
5
-
6
-
7
-
8
-
9
-
10
-
11
-
12
-
13
-
14
-
15
-
16
-
17
-
18
-
19
-
20
-
21
-
22
-
23
-
24
-
25
-
26
-
27
-
28
-
29
-
30
-
31
-
32
-
33
-
34
-
35
-
 36
36 -
 37
37 -
 38
38 -
 39
39 -
 40
40 -
 41
41 -
 42
42 -
 43
43 -
 44
44 -
 45
45 -
 46
46 -
 47
47 -
 48
48 -
 49
49 -
 50
50 -
 51
51 -
 52
52 -
 53
53 -
 54
54 -
 55
55 -
 56
56 -
57
-
58
-
59
-
60
-
61
-
62
-
63
-
64
-
65
-
66
-
67
-
68
-
69
-
70
-
71
-
72
-
73
-
74
-
75
-
76
-
77
-
78
-
79
-
80
-
81
-
82
-
83
-
84
-
85
-
86
-
87
-
88
-
89
-
90
-
91
-
92
-
93
-
94
-
95
-
96
-
97
-
98
-
99
-
100
-
101
-
102
-
103
-
104
-
105
-
106
-
107
-
108
-
109
-
110
-
111
-
112
-
113
-
114
-
115
-
116
-
117
-
118
-
119
-
120
-
121
-
122
-
123
-
124
-
125
-
126
-
127
-
128
 |
 |

Financial Review
44 SIA Annual Report 04/05
CC
MOD: CN1323
M Y
C K
While every effort has been taken to carry out instruction to customers satisfaction
NO RESPONSIBILITY liablilty will be accepted for errors
CUSTOMERS ARE THEREFOREURGED TO CHECK THOROUGHLY BEFORE
AUTHORISING PRINTRUNS
DALIM
1 2 3 4 5 6 7 8 9 10 OK TS
CC196777 DLMAC13 10.06.2005 150#
1
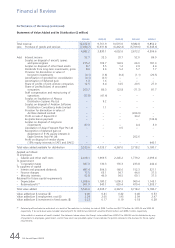
Performance of the Group (continued)
Statement of Value Added and its Distribution ($ million)
2004-05 2003-04 2002-03 2001-02 2000-01
––––––––––––––––––––––––––––––––––––––––––––––––––––––––––––––––––––––––––––––––––––––––––––––––––––––––––––––––––––––––––––––––––––––––––––––––––––––––
Total revenue 12,012.9 9,761.9 10,515.0 9,382.8 9,852.2
Less: Purchase of goods and services (7,030.7) (5,931.8) (6,462.4) (5,709.6) (5,345.6)
––––––––––––––––––––––––––––––––––––––––––––––––––––––––––––––––––––––––––––––––––––––––––––––––––––––––––––––––––––––––––––––––––––––––––––––––––––––––
4,982.2 3,830.1 4,052.6 3,673.2 4,506.6
Add: Interest income 52.7 32.5 33.7 52.0 86.0
Surplus on disposal of aircraft, spares
and spare engines 215.2 102.7 144.9 66.0 181.3
Surplus on disposal of other fixed assets 8.7 5.5 1.2 2.9 2.4
Dividends from long-term investments, gross 8.0 3.6 5.2 5.7 7.7
Provision for diminution in value of
long-term investments (0.1) (1.8) (9.4) (1.1) (20.5)
Amortisation of goodwill on consolidation (0.1) (0.1) – – –
Amortisation of deferred gain 1.3 1.6 – – –
Share of profits of joint venture companies 12.5 6.4 14.5 20.5 27.0
Share of profits/(losses) of associated
companies 203.7 86.3 123.8 (71.3) 81.7
Staff compensation and restructuring of
operations (37.8) (41.4) – – –
Surplus on liquidation of Abacus
Distribution Systems Pte Ltd – 9.2 – – –
Surplus on disposal of Aviation Software
Distribution Consultancy India Limited – 1.1 – – –
Provision for diminution in value of
Air New Zealand Limited – – – (266.9) –
Profit on sale of Equant N.V. – – – 30.2 –
Ex-gratia bonus payment – – – – (134.6)
Surplus on disposal of long-term
investments 87.3 – – 4.4 3.0
Liquidation of Asian Frequent Flyer Pte Ltd – – 0.5 – –
Recognition of deferred gain on
divestment of 51% equity interests in
Eagle Services Asia Pte Ltd – – – 202.6 –
Profit on disposal of vendor shares
(13% equity interests in SATS and SIAEC) – – – – 440.1
––––––––––––––––––––––––––––––––––––––––––––––––––––––––––––––––––––––––––––––––––––––––––––––––––––––––––––––––––––––––––––––––––––––––––––––––––––––––
Total value added available for distribution 5,533.6 4,035.7 4,367.0 3,718.2 5,180.7
––––––––––––––––––––––––––––––––––––––––––––––––––––––––––––––––––––––––––––––––––––––––––––––––––––––––––––––––––––––––––––––––––––––––––––––––––––––––
Applied as follows:
To employees
– Salaries and other staff costs 2,418.1 1,969.5 2,245.2 1,779.2 2,093.4
To government
– Corporation taxes 387.3 130.3 135.3 233.8 242.4
To suppliers of capital
– Interim and proposed dividends 487.4 304.5 166.6 152.3 321.1
– Finance charges 77.5 65.1 54.7 44.0 37.5
– Minority interests 52.8 46.0 54.5 60.1 37.5
Retained for future capital requirements
– Depreciation 1,208.6 1,180.2 1,090.3 969.4 1,145.1
– Retained profit R1 901.9 340.1 620.4 479.4 1,303.7
––––––––––––––––––––––––––––––––––––––––––––––––––––––––––––––––––––––––––––––––––––––––––––––––––––––––––––––––––––––––––––––––––––––––––––––––––––––––
Total value added 5,533.6 4,035.7 4,367.0 3,718.2 5,180.7
––––––––––––––––––––––––––––––––––––––––––––––––––––––––––––––––––––––––––––––––––––––––––––––––––––––––––––––––––––––––––––––––––––––––––––––––––––––––
Value added per $ revenue ($) 0.46 0.41 0.42 0.40 0.53
Value added per $ employment cost ($) 2.29 2.05 1.95 2.09 2.47
Value added per $ investment in fixed assets ($) 0.23 0.17 0.19 0.18 0.28
R1 Retained profit excludes tax write-back as a result of the reduction in statutory tax rate of $204.7 million and $277.8 million for 2003-04 and 2002-03
respectively. If tax write-back were included, retained profit for 2003-04 and 2002-03 would be $544.8 million and $898.2 million respectively.
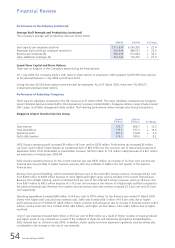
Value added is a measure of wealth created. The statement above shows the Group’s value added from 2000-01 to 2004-05 and its distribution by way
of payments to employees, government, and to those who have provided capital. It also indicates the portion retained in the business for future capital
requirements.