Singapore Airlines 2005 Annual Report Download - page 52
Download and view the complete annual report
Please find page 52 of the 2005 Singapore Airlines annual report below. You can navigate through the pages in the report by either clicking on the pages listed below, or by using the keyword search tool below to find specific information within the annual report.-
 1
1 -
2
-
3
-
4
-
5
-
6
-
7
-
8
-
9
-
10
-
11
-
12
-
13
-
14
-
15
-
16
-
17
-
18
-
19
-
20
-
21
-
22
-
23
-
24
-
25
-
26
-
27
-
28
-
29
-
30
-
31
-
32
-
33
-
34
-
35
-
36
-
37
-
38
-
39
-
40
-
41
-
 42
42 -
 43
43 -
 44
44 -
 45
45 -
 46
46 -
 47
47 -
 48
48 -
 49
49 -
 50
50 -
 51
51 -
 52
52 -
 53
53 -
 54
54 -
 55
55 -
 56
56 -
 57
57 -
 58
58 -
 59
59 -
 60
60 -
 61
61 -
 62
62 -
63
-
64
-
65
-
66
-
67
-
68
-
69
-
70
-
71
-
72
-
73
-
74
-
75
-
76
-
77
-
78
-
79
-
80
-
81
-
82
-
83
-
84
-
85
-
86
-
87
-
88
-
89
-
90
-
91
-
92
-
93
-
94
-
95
-
96
-
97
-
98
-
99
-
100
-
101
-
102
-
103
-
104
-
105
-
106
-
107
-
108
-
109
-
110
-
111
-
112
-
113
-
114
-
115
-
116
-
117
-
118
-
119
-
120
-
121
-
122
-
123
-
124
-
125
-
126
-
127
-
128
 |
 |

Financial Review
50 SIA Annual Report 04/05
CC
MOD: CN1323
M Y
C K
While every effort has been taken to carry out instruction to customers satisfaction
NO RESPONSIBILITY liablilty will be accepted for errors
CUSTOMERS ARE THEREFOREURGED TO CHECK THOROUGHLY BEFORE
AUTHORISING PRINTRUNS
DALIM
1 2 3 4 5 6 7 8 9 10 OK TS
CC196777 DLMAC13 10.06.2005 150#
1
Performance of the Company (continued)
Revenue (continued)
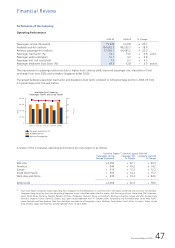
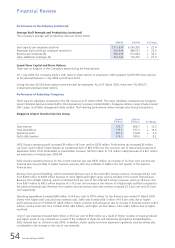
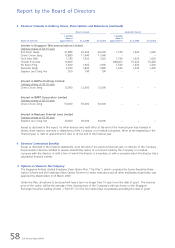
A breakdown of passenger revenue R1 by route region and area of original sale is shown below:
By Route Region ($ million) By Area of Original SaleR2 ($ million)
2004-05 2003-04 % Change 2004-05 2003-04 % Change
–––––––––––––––––––––––––––––––––––––––––––––––––––––––––––––––––––––––––––––––––––––––––––––––––––––––––––––––––––––––––––––––––––––––––––––––––––––––––
East Asia 2,276.0 1,766.0 + 28.9 3,534.6 2,810.4 + 25.8
Americas 1,559.4 1,190.4 + 31.0 751.1 506.3 + 48.4
Europe 1,621.1 1,254.3 + 29.2 1,568.9 1,322.8 + 18.6
South West Pacific 1,379.5 1,122.4 + 22.9 1,266.4 919.3 + 37.8
West Asia and Africa 853.7 676.4 + 26.2 568.7 450.7 + 26.2
–––––––––––––––––––––––––––––––––––––––––––––––––––––––––––––––––––––––––––––––––––––––––––––––––––––––––
Systemwide 7,689.7 6,009.5 + 28.0 7,689.7 6,009.5 + 28.0
–––––––––––––––––––––––––––––––––––––––––––––––––––––––––––––––––––––––––––––––––––––––––––––––––––––––––––––––––––––––––––––––––––––––––––––––––––––––––
R1 Includes excess baggage revenue.
R2 Each area of original sale comprises countries within a region from which the sale is made.
East Asia
Americas
Europe
South West Pacific
West Asia and Africa
Passenger Revenue Composition
by Route Region
-0.2% point
+0.3% point
29.6%
20.3%
21.1%
17.9%
11.1%
+0.5% point
+0.2% point
-0.8% point
Passenger Revenue Composition
by Area of Original Sale
East Asia
Americas
Europe
South West Pacific
West Asia and Africa
-0.1% point
-0.9% point
45.9%
9.8%
20.4%
16.5%
7.4%
+1.4% points
-1.6% points
+1.2%points