Singapore Airlines 2005 Annual Report Download - page 47
Download and view the complete annual report
Please find page 47 of the 2005 Singapore Airlines annual report below. You can navigate through the pages in the report by either clicking on the pages listed below, or by using the keyword search tool below to find specific information within the annual report.-
 1
1 -
2
-
3
-
4
-
5
-
6
-
7
-
8
-
9
-
10
-
11
-
12
-
13
-
14
-
15
-
16
-
17
-
18
-
19
-
20
-
21
-
22
-
23
-
24
-
25
-
26
-
27
-
28
-
29
-
30
-
31
-
32
-
33
-
34
-
35
-
36
-
 37
37 -
 38
38 -
 39
39 -
 40
40 -
 41
41 -
 42
42 -
 43
43 -
 44
44 -
 45
45 -
 46
46 -
 47
47 -
 48
48 -
 49
49 -
 50
50 -
 51
51 -
 52
52 -
 53
53 -
 54
54 -
 55
55 -
 56
56 -
 57
57 -
58
-
59
-
60
-
61
-
62
-
63
-
64
-
65
-
66
-
67
-
68
-
69
-
70
-
71
-
72
-
73
-
74
-
75
-
76
-
77
-
78
-
79
-
80
-
81
-
82
-
83
-
84
-
85
-
86
-
87
-
88
-
89
-
90
-
91
-
92
-
93
-
94
-
95
-
96
-
97
-
98
-
99
-
100
-
101
-
102
-
103
-
104
-
105
-
106
-
107
-
108
-
109
-
110
-
111
-
112
-
113
-
114
-
115
-
116
-
117
-
118
-
119
-
120
-
121
-
122
-
123
-
124
-
125
-
126
-
127
-
128
 |
 |

Financial Review
SIA Annual Report 04/05 45
CC
MOD: CN1323
M Y
C K
While every effort has been taken to carry out instruction to customers satisfaction
NO RESPONSIBILITY liablilty will be accepted for errors
CUSTOMERS ARE THEREFOREURGED TO CHECK THOROUGHLY BEFORE
AUTHORISING PRINTRUNS
DALIM
1 2 3 4 5 6 7 8 9 10 OK TS
CC196777 DLMAC13 10.06.2005 150#
1
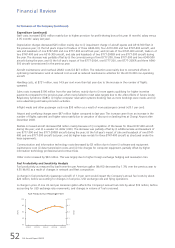
Performance of the Group (continued)
Value Added
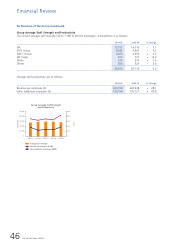
Total value added for 2004-05 improved 37.1 per cent (+$1,498 million) to $5,534 million. The increase was mainly
attributable to higher revenue (+$2,251 million), higher share of profits of associated and joint venture companies (+$124
million), higher surplus on disposal of aircraft, spares and spare engines (+$113 million) and surplus on sale of long-term
investments (+$87 million), partially offset by higher purchase of goods and services (-$1,099 million).
Payroll and other staff cost accounted for 43.7 per cent of the value added, 5.1 percentage points lower than the previous
year. $487 million (8.8 per cent) of the value added was for distribution to shareholders, $78 million (1.4 per cent) for
finance charges, and $53 million (1.0 per cent) belonged to minority interests. $2,111 million was retained for future capital
requirements.
Group Value Added Distribution
$ Million
$ Million
2000-01 2001-02 2002-03 2003-04 2004-05
2,500
2,000
1,500
1,000
500
0
Retained in the Business
Employees
Suppliers of Capital
Government
2,500
2,000
1,500
1,000
500
0
R1
R1
Group Valued Added Distribution
2004-05
+0.9% point
-5.1% points
+0.4% point
+3.8% points
Retained in the Business 2,111 38.1
Suppliers of Capital 618 11.2
Government 387 7.0
Employees 2,418 43.7
Total Value Added
$million Distribution
%
43.7% 38.1%
11.2%
7.0%
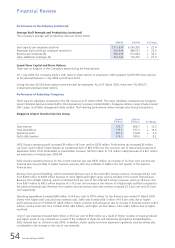
Group Value Added Productivity Ratios
Dollar
Dollar
2000-01 2001-02 2002-03 2003-04 2004-05
Value Added Per $ Employment Cost
Value Added Per $ Revenue
Value Added Per $ Investment in Fixed Assets
2.5
2.0
1.5
1.0
0.5
0
2.5
2.0
1.5
1.0
0.5
0
R1 Excludes write-back of prior year's tax liabilities of $204.7
million and $277.8 million for 2003-04 and 2002-03
respectively arising from reduction in statutory tax rate.