Singapore Airlines 2005 Annual Report Download - page 116
Download and view the complete annual report
Please find page 116 of the 2005 Singapore Airlines annual report below. You can navigate through the pages in the report by either clicking on the pages listed below, or by using the keyword search tool below to find specific information within the annual report.-
 1
1 -
2
-
3
-
4
-
5
-
6
-
7
-
8
-
9
-
10
-
11
-
12
-
13
-
14
-
15
-
16
-
17
-
18
-
19
-
20
-
21
-
22
-
23
-
24
-
25
-
26
-
27
-
28
-
29
-
30
-
31
-
32
-
33
-
34
-
35
-
36
-
37
-
38
-
39
-
40
-
41
-
42
-
43
-
44
-
45
-
46
-
47
-
48
-
49
-
50
-
51
-
52
-
53
-
54
-
55
-
56
-
57
-
58
-
59
-
60
-
61
-
62
-
63
-
64
-
65
-
66
-
67
-
68
-
69
-
70
-
71
-
72
-
73
-
74
-
75
-
76
-
77
-
78
-
79
-
80
-
81
-
82
-
83
-
84
-
85
-
86
-
87
-
88
-
89
-
90
-
91
-
92
-
93
-
94
-
95
-
96
-
97
-
98
-
99
-
100
-
101
-
102
-
103
-
104
-
105
-
 106
106 -
 107
107 -
 108
108 -
 109
109 -
 110
110 -
 111
111 -
 112
112 -
 113
113 -
 114
114 -
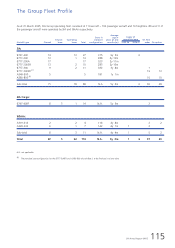
 115
115 -
 116
116 -
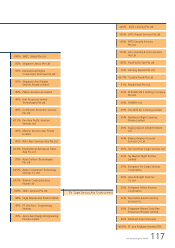
 117
117 -
 118
118 -
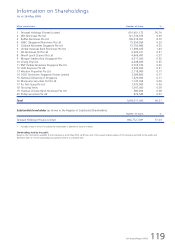
 119
119 -
 120
120 -
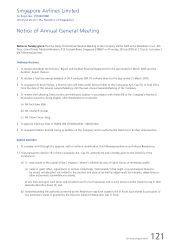
 121
121 -
 122
122 -
 123
123 -
 124
124 -
 125
125 -
 126
126 -
127
-
128
 |
 |

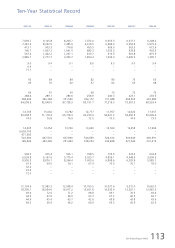
114 SIA Annual Report 04/05
Ten-Year Charts
10,000
8,000
6,000
4,000
2,000
Company Revenue and Expenditure R1
$ Million
$ Million
95 96 97 98 99 00 01 02 03 04
96 97 98 99 00 01 02 03 04 05
Revenue
Expenditure
10,000
8,000
6,000
4,000
2,000
2,000
1,500
1,000
500
0
Company Profit Before and After Taxation R1
$ Million
$ Million
95 96 97 98 99 00 01 02 03 04
96 97 98 99 00 01 02 03 04 05
Profit After Taxation
Profit Before Taxation
2,000
1,500
1,000
500
0
8,000
6,000
4,000
2,000
0
SIA and SIA Cargo Passenger
and Cargo Load
Cargo Tonne-km (Million)
Revenue Passenger-km (Million)
95 96 97 98 99 00 01 02 03 04
96 97 98 99 00 01 02 03 04 05
Revenue Passenger-km
Cargo Tonne-km
80,000
60,000
40,000
20,000
0
1,200
900
600
300
0
SIA and SIA Cargo Passenger
and Cargo Carried
Cargo Tonne (’000)
Passenger Number (’000)
95 96 97 98 99 00 01 02 03 04
96 97 98 99 00 01 02 03 04 05
Passenger Number
Cargo Tonne
16,000
14,000
12,000
10,000
8,000
Average Operating Fleet Age:
SIA and Industry Wide
Age (Months)
Age (Months)
96 97 98 99 00 01 02 03 04 05
31 March
Industry Wide R2
SIA
180
150
120
90
60
30
0
180
150
120
90
60
30
0
R1 SIA cargo was corporatised on 1 July 2001. Company revenue, expenditure, profit before and after taxation in these charts for 2000-01 and prior years
show the combined results of both passenger and cargo operations. The numbers for 2001-02 include cargo operations for the first three months only
(April to June 2001).
Average age of SIA passenger fleet: 5 years 4 months
(as at 31 March 2005).
R2 Source: Avsoft Information Systems, Ruby, England.
CC
MOD: CN1323
M Y
C K
While every effort has been taken to carry out instruction to customers satisfaction
NO RESPONSIBILITY liablilty will be accepted for errors
CUSTOMERS ARE THEREFOREURGED TO CHECK THOROUGHLY BEFORE
AUTHORISING PRINTRUNS
DALIM
1 2 3 4 5 6 7 8 9 10 OK TS
CC196777 DLMAC13 10.06.2005 150#
1