Singapore Airlines 2005 Annual Report Download - page 100
Download and view the complete annual report
Please find page 100 of the 2005 Singapore Airlines annual report below. You can navigate through the pages in the report by either clicking on the pages listed below, or by using the keyword search tool below to find specific information within the annual report.-
 1
1 -
2
-
3
-
4
-
5
-
6
-
7
-
8
-
9
-
10
-
11
-
12
-
13
-
14
-
15
-
16
-
17
-
18
-
19
-
20
-
21
-
22
-
23
-
24
-
25
-
26
-
27
-
28
-
29
-
30
-
31
-
32
-
33
-
34
-
35
-
36
-
37
-
38
-
39
-
40
-
41
-
42
-
43
-
44
-
45
-
46
-
47
-
48
-
49
-
50
-
51
-
52
-
53
-
54
-
55
-
56
-
57
-
58
-
59
-
60
-
61
-
62
-
63
-
64
-
65
-
66
-
67
-
68
-
69
-
70
-
71
-
72
-
73
-
74
-
75
-
76
-
77
-
78
-
79
-
80
-
81
-
82
-
83
-
84
-
85
-
86
-
87
-
88
-
89
-
 90
90 -
 91
91 -
 92
92 -
 93
93 -
 94
94 -
 95
95 -
 96
96 -
 97
97 -
 98
98 -
 99
99 -
 100
100 -
 101
101 -
 102
102 -
 103
103 -
 104
104 -
 105
105 -
 106
106 -
 107
107 -
 108
108 -
 109
109 -
 110
110 -
111
-
112
-
113
-
114
-
115
-
116
-
117
-
118
-
119
-
120
-
121
-
122
-
123
-
124
-
125
-
126
-
127
-
128
 |
 |

98 SIA Annual Report 04/05
Notes to the Financial Statements
31 March 2005
CC
MOD: CN1323
M Y
C K
While every effort has been taken to carry out instruction to customers satisfaction
NO RESPONSIBILITY liablilty will be accepted for errors
CUSTOMERS ARE THEREFOREURGED TO CHECK THOROUGHLY BEFORE
AUTHORISING PRINTRUNS
DALIM
1 2 3 4 5 6 7 8 9 10 OK TS
CC196777 DLMAC13 10.06.2005 150#
13col
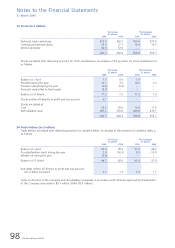
23 Stocks (in $ million)
The Group The Company
31 March 31 March
2005 2004 2005 2004
––––––––––––––––––––––––––––––––––––––––––––––––––––––––––––––––––––––––––––––––––––––––––––––––––––––––––––––––––––––––––––––––––––––––––––––––––
Technical stocks and stores 375.0 363.7 350.4 337.4
Catering and general stocks 26.9 27.1 18.4 19.3
Work-in-progress 40.6 12.6 – –
–––––––––––––––––––––––––––––––––––––––––––––––––––––––––––––––––––––
442.5 403.4 368.8 356.7
–––––––––––––––––––––––––––––––––––––––––––––––––––––––––––––––––––––
Stocks are stated after deducting provision for stock obsolescence. An analysis of the provision for stock obsolescence is
as follows:
The Group The Company
31 March 31 March
2005 2004 2005 2004
––––––––––––––––––––––––––––––––––––––––––––––––––––––––––––––––––––––––––––––––––––––––––––––––––––––––––––––––––––––––––––––––––––––––––––––––––
Balance at 1 April 7.5 4.9 1.0 –
Provided during the year 13.1 3.0 10.2 1.0
Provision utilised during the year (0.3) (0.4) – –
Amounts reclassified to fixed assets (3.0) – – –
–––––––––––––––––––––––––––––––––––––––––––––––––––––––––––––––––––––
Balance at 31 March 17.3 7.5 11.2 1.0
–––––––––––––––––––––––––––––––––––––––––––––––––––––––––––––––––––––
Stocks written-off directly to profit and loss account 0.1 – – –
–––––––––––––––––––––––––––––––––––––––––––––––––––––––––––––––––––––
Stocks are stated at:
Cost 55.3 33.4 19.0 17.0
Net realisable value 387.2 370.0 349.8 339.7
–––––––––––––––––––––––––––––––––––––––––––––––––––––––––––––––––––––
442.5 403.4 368.8 356.7
–––––––––––––––––––––––––––––––––––––––––––––––––––––––––––––––––––––
24 Trade Debtors (in $ million)
Trade debtors are stated after deducting provision for doubtful debts. An analysis of the provision for doubtful debts is
as follows:
The Group The Company
31 March 31 March
2005 2004 2005 2004
––––––––––––––––––––––––––––––––––––––––––––––––––––––––––––––––––––––––––––––––––––––––––––––––––––––––––––––––––––––––––––––––––––––––––––––––––
Balance at 1 April 62.0 78.3 37.9 48.0
Provided/(written-back) during the year 2.8 (16.3) 4.5 (10.1)
Written-off during the year (0.6) – – –
–––––––––––––––––––––––––––––––––––––––––––––––––––––––––––––––––––––
Balance at 31 March 64.2 62.0 42.4 37.9
–––––––––––––––––––––––––––––––––––––––––––––––––––––––––––––––––––––
Bad debts written-off directly to profit and loss account,
net of debts recovered 2.1 1.2 2.3 1.7
–––––––––––––––––––––––––––––––––––––––––––––––––––––––––––––––––––––
Loans to directors of the Company and its subsidiary companies in accordance with schemes approved by shareholders
of the Company amounted to $0.1 million (2004: $0.3 million).