Singapore Airlines 2005 Annual Report Download - page 70
Download and view the complete annual report
Please find page 70 of the 2005 Singapore Airlines annual report below. You can navigate through the pages in the report by either clicking on the pages listed below, or by using the keyword search tool below to find specific information within the annual report.-
 1
1 -
2
-
3
-
4
-
5
-
6
-
7
-
8
-
9
-
10
-
11
-
12
-
13
-
14
-
15
-
16
-
17
-
18
-
19
-
20
-
21
-
22
-
23
-
24
-
25
-
26
-
27
-
28
-
29
-
30
-
31
-
32
-
33
-
34
-
35
-
36
-
37
-
38
-
39
-
40
-
41
-
42
-
43
-
44
-
45
-
46
-
47
-
48
-
49
-
50
-
51
-
52
-
53
-
54
-
55
-
56
-
57
-
58
-
59
-
 60
60 -
 61
61 -
 62
62 -
 63
63 -
 64
64 -
 65
65 -
 66
66 -
 67
67 -
 68
68 -
 69
69 -
 70
70 -
 71
71 -
 72
72 -
 73
73 -
 74
74 -
 75
75 -
 76
76 -
 77
77 -
 78
78 -
 79
79 -
 80
80 -
81
-
82
-
83
-
84
-
85
-
86
-
87
-
88
-
89
-
90
-
91
-
92
-
93
-
94
-
95
-
96
-
97
-
98
-
99
-
100
-
101
-
102
-
103
-
104
-
105
-
106
-
107
-
108
-
109
-
110
-
111
-
112
-
113
-
114
-
115
-
116
-
117
-
118
-
119
-
120
-
121
-
122
-
123
-
124
-
125
-
126
-
127
-
128
 |
 |

68 SIA Annual Report 04/05
CC
MOD: CN1323
M Y
C K
While every effort has been taken to carry out instruction to customers satisfaction
NO RESPONSIBILITY liablilty will be accepted for errors
CUSTOMERS ARE THEREFOREURGED TO CHECK THOROUGHLY BEFORE
AUTHORISING PRINTRUNS
DALIM
1 2 3 4 5 6 7 8 9 10 OK TS
CC196777 DLMAC13 10.06.2005 150#
13col
The Group
Notes 2004-05 2003-04
–––––––––––––––––––––––––––––––––––––––––––––––––––––––––––––––––––––––––––––––––––––––––––––––––––––––––––––––––––––––––––––––––––––––––––––––––––––––––
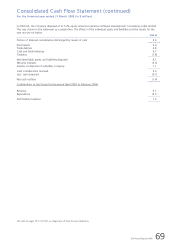
NET CASH PROVIDED BY OPERATING ACTIVITIES 29 2,786.6 1,760.5
––––––––––––––––––––––––––––––––––
CASH FLOW FROM INVESTING ACTIVITIES
Capital expenditure 30 (2,095.2) (2,258.3)
Proceeds from disposal of aircraft and other fixed assets 1,081.2 1,513.7
Return of capital from associated companies 3.3 –
Return of capital from joint venture companies – 0.9
Return of capital from long-term investments 13.9 –
Investments in associated companies (184.1) (24.6)
Investments in joint venture companies (10.7) (21.5)
Disposal of subsidiary company, net of cash disposed – (1.4)
Additional long-term investments (285.7) –
Additional long-term loans (1.4) (1.4)
Repayment of loans by associated companies 0.7 5.5
Repayment of loans 4.1 6.4
Proceeds from sale of long-term investments 349.9 76.8
Dividends received from associated and joint venture companies 55.7 60.5
Dividends received from investments 8.4 3.8
Interest received from investments and deposits 50.0 32.7
Interest received on loans to associated companies – 0.1
––––––––––––––––––––––––––––––––––
NET CASH USED IN INVESTING ACTIVITIES (1,009.9) (606.8)
––––––––––––––––––––––––––––––––––
CASH FLOW FROM FINANCING ACTIVITIES
Dividends paid (426.4) (109.6)
Dividends paid by subsidiary companies to minority interests (91.8) (14.4)
Interest paid (67.8) (62.1)
Proceeds from borrowings 202.5 2.8
Repayment of borrowings (24.4) (224.7)
Repayment of long-term lease liabilities (46.1) (20.3)
Proceeds from exercise of share options 59.3 15.3
––––––––––––––––––––––––––––––––––
NET CASH USED IN FINANCING ACTIVITIES (394.7) (413.0)
––––––––––––––––––––––––––––––––––
NET CASH INFLOW 1,382.0 740.7
CASH AND CASH EQUIVALENTS AT BEGINNING OF FINANCIAL YEAR 1,491.4 789.3
Effect of exchange rate changes (59.4) (38.6)
––––––––––––––––––––––––––––––––––
CASH AND CASH EQUIVALENTS AT END OF FINANCIAL YEAR 2,814.0 1,491.4
––––––––––––––––––––––––––––––––––
ANALYSIS OF CASH AND CASH EQUIVALENTS
Fixed deposits 26 2,231.9 1,137.1
Cash and bank 26 608.3 381.4
Bank overdrafts (26.2) (27.1)
––––––––––––––––––––––––––––––––––
CASH AND CASH EQUIVALENTS AT END OF FINANCIAL YEAR 2,814.0 1,491.4
––––––––––––––––––––––––––––––––––
The notes on pages 70 to 107 form an integral part of these financial statements.
Consolidated Cash Flow Statement
For the financial year ended 31 March 2005 (in $ million)