Singapore Airlines 2005 Annual Report Download - page 57
Download and view the complete annual report
Please find page 57 of the 2005 Singapore Airlines annual report below. You can navigate through the pages in the report by either clicking on the pages listed below, or by using the keyword search tool below to find specific information within the annual report.-
 1
1 -
2
-
3
-
4
-
5
-
6
-
7
-
8
-
9
-
10
-
11
-
12
-
13
-
14
-
15
-
16
-
17
-
18
-
19
-
20
-
21
-
22
-
23
-
24
-
25
-
26
-
27
-
28
-
29
-
30
-
31
-
32
-
33
-
34
-
35
-
36
-
37
-
38
-
39
-
40
-
41
-
42
-
43
-
44
-
45
-
46
-
 47
47 -
 48
48 -
 49
49 -
 50
50 -
 51
51 -
 52
52 -
 53
53 -
 54
54 -
 55
55 -
 56
56 -
 57
57 -
 58
58 -
 59
59 -
 60
60 -
 61
61 -
 62
62 -
 63
63 -
 64
64 -
 65
65 -
 66
66 -
 67
67 -
68
-
69
-
70
-
71
-
72
-
73
-
74
-
75
-
76
-
77
-
78
-
79
-
80
-
81
-
82
-
83
-
84
-
85
-
86
-
87
-
88
-
89
-
90
-
91
-
92
-
93
-
94
-
95
-
96
-
97
-
98
-
99
-
100
-
101
-
102
-
103
-
104
-
105
-
106
-
107
-
108
-
109
-
110
-
111
-
112
-
113
-
114
-
115
-
116
-
117
-
118
-
119
-
120
-
121
-
122
-
123
-
124
-
125
-
126
-
127
-
128
 |
 |

Financial Review
SIA Annual Report 04/05 55
CC
MOD: CN1323
M Y
C K
While every effort has been taken to carry out instruction to customers satisfaction
NO RESPONSIBILITY liablilty will be accepted for errors
CUSTOMERS ARE THEREFOREURGED TO CHECK THOROUGHLY BEFORE
AUTHORISING PRINTRUNS
DALIM
1 2 3 4 5 6 7 8 9 10 OK TS
CC196777 DLMAC13 10.06.2005 150#
1
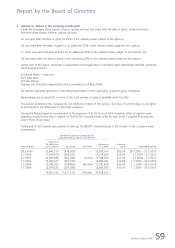
Performance of Subsidiary Companies (continued)
Singapore Airport Terminal Services Group (continued)
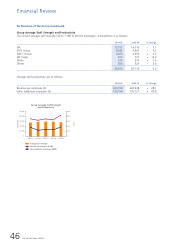
Profit contribution from overseas through associated companies, which represents 20.0 per cent of the SATS Group’s profit
before tax and exceptional item, increased 49.4 per cent to $51 million for the financial year ended 31 March 2005, mainly
from the doubling of equity stake in Asia Airfreight Terminal, and improved profits from the China and Vietnam associated
companies.
The SATS Group’s shareholders’ funds was $1,068 million (-13.0 per cent) as at 31 March 2005. This was after payment
of special and final dividends for FY2003-04 of $302 million and $41 million respectively in August 2004, and interim
dividend for FY2004-05 of $25 million in November 2004. Return on average shareholders’ funds at 15.1 per cent, was 1.3
percentage points lower than FY2003-04.
Basic earnings per share declined 1.9 cents to 17.0 cents, while net asset value per share dropped $0.18 to $1.04.
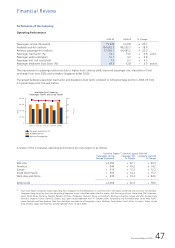
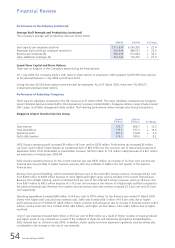
SIA Engineering Group
2004-05 2003-04
$ million $ million % Change
––––––––––––––––––––––––––––––––––––––––––––––––––––––––––––––––––––––––––––––––––––––––––––––––––––––––––––––––––––––––––––––––––––––––––––––––––––––––
Total revenue 807.5 678.7 + 19.0
Total expenditure 702.0 599.8 + 17.0
Operating profit 105.5 78.9 + 33.7
Profit after taxation 175.4 140.0 + 25.3
––––––––––––––––––––––––––––––––––––––––––––––––––––––––––––––––––––––––––––––––––––––––––––––––––––––––––––––––––––––––––––––––––––––––––––––––––––––––
SIAEC Group’s operating profit for the financial year 2004-05 was $106 million, up $27 million (+33.7 per cent) from last
year. Revenue was $129 million (+19.0 per cent) higher at $808 million. The increase in revenue came mainly from the
Company's core activities of airframe and component overhaul and line maintenance.
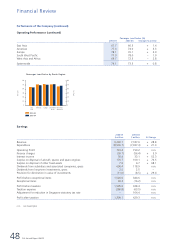
Expenditure rose $102 million (+17.0 per cent) to $702 million, primarily due to higher staff costs and material costs. Staff
costs rose by $74 million (+25.9 per cent), mainly due to a higher provision for profit-sharing bonus and higher overtime
costs. Material costs increased by $22 million (+12.0 per cent) in tandem with higher business volume.
Profit before tax rose 54.4 per cent (+$70 million) boosted by gain on sale of a long-term investment, dividend income
received from an investee company and improved performance of SIAEC Group’s associated and joint venture companies.
Share of profits from associated and joint venture companies, which grew by $27 million (+54.7 per cent), represented 37.9
per cent of SIAEC Group's pre-tax profits.
Shareholders’ funds decreased 7.3 per cent to $859 million for the financial year ended 31 March 2005. This was mainly
due to the payment of $227 million in August 2004 for the final and special dividends declared in respect of the previous
financial year. Net asset per share declined 7.7 cents to 84.4 cents. Return on average shareholders' funds was 19.6 per
cent, an increase of 3.7 percentage points from 2003-04. Basic earnings per share rose 23.6 per cent to 17.3 cents.
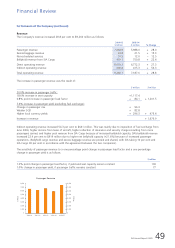
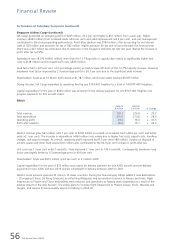
Singapore Airlines Cargo
2004-05 2003-04 R1
$ million $ million % Change
––––––––––––––––––––––––––––––––––––––––––––––––––––––––––––––––––––––––––––––––––––––––––––––––––––––––––––––––––––––––––––––––––––––––––––––––––––––––
Total revenue 2,864.5 2,402.0 + 19.3
Total expenditure 2,602.0 2,200.4 + 18.3
Operating profit 262.5 201.6 + 30.2
Profit after taxation 183.8 175.9 + 4.5
––––––––––––––––––––––––––––––––––––––––––––––––––––––––––––––––––––––––––––––––––––––––––––––––––––––––––––––––––––––––––––––––––––––––––––––––––––––––
R1 Revenue, expenditure, yield and unit cost for 2003-04 are restated to reflect the change in the basis of reporting cargo revenue. Previously, commissions
were computed based on published rates for both gross and net sales, which formed part of cargo revenue. Correspondingly, the commissions were
shown as an operating expenditure item under commissions and incentives. In line with industry practice, in FY2004-05, only commissions on gross sales
are included as cargo revenue, while net sales are reported net of commissions. This change in reporting is more reflective of the revenue generated and
the values that are billed to the agents. This change does not have any impact on the operating profit.