Singapore Airlines 2005 Annual Report Download - page 101
Download and view the complete annual report
Please find page 101 of the 2005 Singapore Airlines annual report below. You can navigate through the pages in the report by either clicking on the pages listed below, or by using the keyword search tool below to find specific information within the annual report.-
 1
1 -
2
-
3
-
4
-
5
-
6
-
7
-
8
-
9
-
10
-
11
-
12
-
13
-
14
-
15
-
16
-
17
-
18
-
19
-
20
-
21
-
22
-
23
-
24
-
25
-
26
-
27
-
28
-
29
-
30
-
31
-
32
-
33
-
34
-
35
-
36
-
37
-
38
-
39
-
40
-
41
-
42
-
43
-
44
-
45
-
46
-
47
-
48
-
49
-
50
-
51
-
52
-
53
-
54
-
55
-
56
-
57
-
58
-
59
-
60
-
61
-
62
-
63
-
64
-
65
-
66
-
67
-
68
-
69
-
70
-
71
-
72
-
73
-
74
-
75
-
76
-
77
-
78
-
79
-
80
-
81
-
82
-
83
-
84
-
85
-
86
-
87
-
88
-
89
-
90
-
 91
91 -
 92
92 -
 93
93 -
 94
94 -
 95
95 -
 96
96 -
 97
97 -
 98
98 -
 99
99 -
 100
100 -
 101
101 -
 102
102 -
 103
103 -
 104
104 -
 105
105 -
 106
106 -
 107
107 -
 108
108 -
 109
109 -
 110
110 -
 111
111 -
112
-
113
-
114
-
115
-
116
-
117
-
118
-
119
-
120
-
121
-
122
-
123
-
124
-
125
-
126
-
127
-
128
 |
 |

SIA Annual Report 04/05 99
Notes to the Financial Statements
31 March 2005
CC
MOD: CN1323
M Y
C K
While every effort has been taken to carry out instruction to customers satisfaction
NO RESPONSIBILITY liablilty will be accepted for errors
CUSTOMERS ARE THEREFOREURGED TO CHECK THOROUGHLY BEFORE
AUTHORISING PRINTRUNS
DALIM
1 2 3 4 5 6 7 8 9 10 OK TS
CC196777 DLMAC13 10.06.2005 150#
1
3col
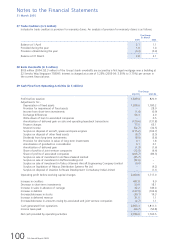
25 Investments (in $ million)
The Group
31 March
2005 2004
––––––––––––––––––––––––––––––––––––––––––––––––––––––––––––––––––––––––––––––––––––––––––––––––––––––––––––––––––––––––––––––––––––––––––––––––––
Quoted investments at cost
Government securities 6.9 4.6
Equity investments 21.3 16.8
Non-equity investments 14.3 14.6
–––––––––––––––––––––––––––––––––
42.5 36.0
–––––––––––––––––––––––––––––––––
Unquoted investments at cost
Non-equity investments 37.7 94.8
–––––––––––––––––––––––––––––––––
80.2 130.8
–––––––––––––––––––––––––––––––––
Provision for diminution
Government securities (0.1) –
Non-equity investments, quoted (0.8) (0.6)
–––––––––––––––––––––––––––––––––
(0.9) (0.6)
–––––––––––––––––––––––––––––––––
79.3 130.2
–––––––––––––––––––––––––––––––––
Market value of quoted investments
Government securities 6.8 4.6
Equity investments 24.7 20.5
Non-equity investments 13.5 14.0
–––––––––––––––––––––––––––––––––
45.0 39.1
–––––––––––––––––––––––––––––––––
Analysis of provision for diminution in value
of quoted investments:
Balance at 1 April 0.6 2.8
Provided/(written-back) during the year 0.3 (2.2)
–––––––––––––––––––––––––––––––––
Balance at 31 March 0.9 0.6
–––––––––––––––––––––––––––––––––
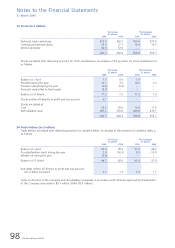
26 Cash and Bank Balances (in $ million)
The Group The Company
31 March 31 March
2005 2004 2005 2004
––––––––––––––––––––––––––––––––––––––––––––––––––––––––––––––––––––––––––––––––––––––––––––––––––––––––––––––––––––––––––––––––––––––––––––––––––
Fixed deposits 2,231.9 1,137.1 2,049.1 918.3
Cash and bank 608.3 381.4 460.0 172.3
–––––––––––––––––––––––––––––––––––––––––––––––––––––––––––––––––––––
2,840.2 1,518.5 2,509.1 1,090.6
–––––––––––––––––––––––––––––––––––––––––––––––––––––––––––––––––––––