Singapore Airlines 2005 Annual Report Download - page 56
Download and view the complete annual report
Please find page 56 of the 2005 Singapore Airlines annual report below. You can navigate through the pages in the report by either clicking on the pages listed below, or by using the keyword search tool below to find specific information within the annual report.-
 1
1 -
2
-
3
-
4
-
5
-
6
-
7
-
8
-
9
-
10
-
11
-
12
-
13
-
14
-
15
-
16
-
17
-
18
-
19
-
20
-
21
-
22
-
23
-
24
-
25
-
26
-
27
-
28
-
29
-
30
-
31
-
32
-
33
-
34
-
35
-
36
-
37
-
38
-
39
-
40
-
41
-
42
-
43
-
44
-
45
-
 46
46 -
 47
47 -
 48
48 -
 49
49 -
 50
50 -
 51
51 -
 52
52 -
 53
53 -
 54
54 -
 55
55 -
 56
56 -
 57
57 -
 58
58 -
 59
59 -
 60
60 -
 61
61 -
 62
62 -
 63
63 -
 64
64 -
 65
65 -
 66
66 -
67
-
68
-
69
-
70
-
71
-
72
-
73
-
74
-
75
-
76
-
77
-
78
-
79
-
80
-
81
-
82
-
83
-
84
-
85
-
86
-
87
-
88
-
89
-
90
-
91
-
92
-
93
-
94
-
95
-
96
-
97
-
98
-
99
-
100
-
101
-
102
-
103
-
104
-
105
-
106
-
107
-
108
-
109
-
110
-
111
-
112
-
113
-
114
-
115
-
116
-
117
-
118
-
119
-
120
-
121
-
122
-
123
-
124
-
125
-
126
-
127
-
128
 |
 |

Financial Review
54 SIA Annual Report 04/05
CC
MOD: CN1323
M Y
C K
While every effort has been taken to carry out instruction to customers satisfaction
NO RESPONSIBILITY liablilty will be accepted for errors
CUSTOMERS ARE THEREFOREURGED TO CHECK THOROUGHLY BEFORE
AUTHORISING PRINTRUNS
DALIM
1 2 3 4 5 6 7 8 9 10 OK TS
CC196777 DLMAC13 10.06.2005 150#
1
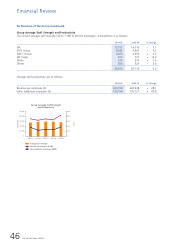
Performance of the Company (continued)
Average Staff Strength and Productivity (continued)
The Company’s average staff productivity rates are shown below:
2004-05 2003-04 % Change
––––––––––––––––––––––––––––––––––––––––––––––––––––––––––––––––––––––––––––––––––––––––––––––––––––––––––––––––––––––––––––––––––––––––––––––––––––––––
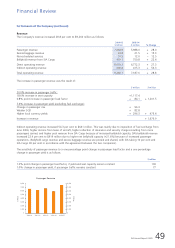
Seat capacity per employee (seat-km) 7,711,634 6,299,265 + 22.4
Passenger load carried per employee (tonne-km) 549,904 448,513 + 22.6
Revenue per employee ($) 682,294 513,034 + 33.0
Value added per employee ($) 301,024 179,272 + 67.9
––––––––––––––––––––––––––––––––––––––––––––––––––––––––––––––––––––––––––––––––––––––––––––––––––––––––––––––––––––––––––––––––––––––––––––––––––––––––
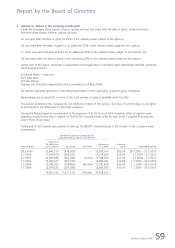
Issued Share Capital and Share Options
There was no buyback of the Company’s shares during the financial year.
On 1 July 2004, the Company made a sixth grant of share options to employees. Staff accepted 12,879,325 share options
to be exercised between 1 July 2005 and 30 June 2014.
During the year, 95,024 share options were exercised by employees. As at 31 March 2005, there were 74,338,615
unexercised employee share options.
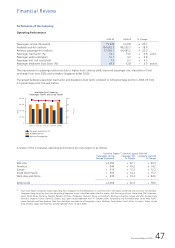
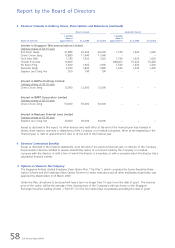
Performance of Subsidiary Companies
There were 25 subsidiary companies in the SIA Group as at 31 March 2005. The major subsidiary companies are Singapore
Airport Terminal Services Limited (SATS), SIA Engineering Company Limited (SIAEC), Singapore Airlines Cargo Private Limited
(SIA Cargo), and SilkAir (Singapore) Private Limited. The following performance review includes intra-Group transactions.
Singapore Airport Terminal Services Group
2004-05 2003-04
$ million $ million % Change
––––––––––––––––––––––––––––––––––––––––––––––––––––––––––––––––––––––––––––––––––––––––––––––––––––––––––––––––––––––––––––––––––––––––––––––––––––––––
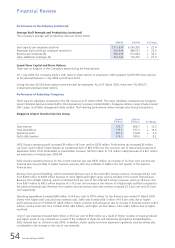
Total revenue 975.7 868.7 + 12.3
Total expenditure 775.5 677.9 + 14.4
Operating profit 200.2 190.8 + 4.9
Profit after taxation 174.1 189.6 – 8.2
––––––––––––––––––––––––––––––––––––––––––––––––––––––––––––––––––––––––––––––––––––––––––––––––––––––––––––––––––––––––––––––––––––––––––––––––––––––––
SATS Group’s operating profit increased $9 million (+4.9 per cent) to $200 million. Profit before tax increased $6 million
(+2.6 per cent) to $223 million despite an exceptional item of $29 million for the one-time cost of restructuring exercise in
September 2004. Profit attributable to shareholders however, fell $16 million to 174 million mainly because of a $21 million
tax write-back in financial year 2003-04.
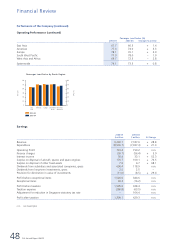
SATS Group’s operating revenue for the current financial year was $976 million, an increase of 12.3 per cent over the last
financial year due primarily to higher business volumes, after the outbreak of SARS in the first quarter of the previous
financial year.
Revenue from ground handling, which constituted 44.9 per cent of the total SATS Group's revenue, increased 4.8 per cent
from $418 million to $438 million because of more flights and higher cargo volume handled in the current financial year.
Revenue from inflight catering, which constituted 43.4 per cent of the total SATS Group's revenue, went up 18.6 per cent
from $367 million to $423 million because of a 19.3 per cent increase in the volume of inflight meals uplifted compared to
the previous financial year. Revenue from aviation security services and other services increased 22.5 per cent and 20.9 per
cent respectively.
Operating expenditure increased $98 million (+14.4 per cent) to $776 million for the financial year ended 31 March 2005
mainly from higher staff costs and raw material costs. Staff costs increased $61 million (+16.6 per cent) due to higher
profit-sharing bonus in FY2004-05 (+$26 million), higher overtime and allowances due to increase in business volume (+$14
million), service increment from October 2004 (+$5 million), and higher contract labour costs (+$21 million) due to higher
workload.
Cost of raw materials increased $24 million or 35.6 per cent to $90 million as a result of higher number of meals produced
and higher prices of raw materials as a result of the outbreak of Avian flu and the Bovine Spongiform Encephalopathy
(BSE) induced ban on US beef in late 2003. In addition, better quality and more expensive ingredients used by airlines also
contributed to the increase in the cost of raw materials.