Singapore Airlines 2005 Annual Report Download - page 83
Download and view the complete annual report
Please find page 83 of the 2005 Singapore Airlines annual report below. You can navigate through the pages in the report by either clicking on the pages listed below, or by using the keyword search tool below to find specific information within the annual report.-
 1
1 -
2
-
3
-
4
-
5
-
6
-
7
-
8
-
9
-
10
-
11
-
12
-
13
-
14
-
15
-
16
-
17
-
18
-
19
-
20
-
21
-
22
-
23
-
24
-
25
-
26
-
27
-
28
-
29
-
30
-
31
-
32
-
33
-
34
-
35
-
36
-
37
-
38
-
39
-
40
-
41
-
42
-
43
-
44
-
45
-
46
-
47
-
48
-
49
-
50
-
51
-
52
-
53
-
54
-
55
-
56
-
57
-
58
-
59
-
60
-
61
-
62
-
63
-
64
-
65
-
66
-
67
-
68
-
69
-
70
-
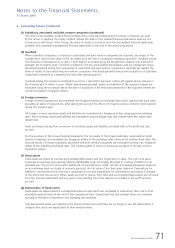
71
-
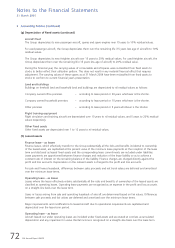
72
-
 73
73 -
 74
74 -
 75
75 -
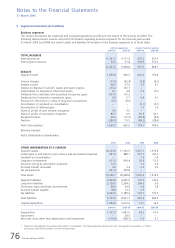
 76
76 -
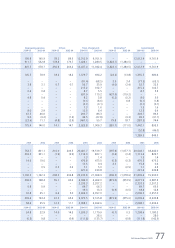
 77
77 -
 78
78 -
 79
79 -
 80
80 -
 81
81 -
 82
82 -
 83
83 -
 84
84 -
 85
85 -
 86
86 -
 87
87 -
 88
88 -
 89
89 -
 90
90 -
 91
91 -
 92
92 -
 93
93 -
94
-
95
-
96
-
97
-
98
-
99
-
100
-
101
-
102
-
103
-
104
-
105
-
106
-
107
-
108
-
109
-
110
-
111
-
112
-
113
-
114
-
115
-
116
-
117
-
118
-
119
-
120
-
121
-
122
-
123
-
124
-
125
-
126
-
127
-
128
 |
 |

SIA Annual Report 04/05 81
Notes to the Financial Statements
31 March 2005
CC
MOD: CN1323
M Y
C K
While every effort has been taken to carry out instruction to customers satisfaction
NO RESPONSIBILITY liablilty will be accepted for errors
CUSTOMERS ARE THEREFOREURGED TO CHECK THOROUGHLY BEFORE
AUTHORISING PRINTRUNS
DALIM
1 2 3 4 5 6 7 8 9 10 OK TS
CC196777 DLMAC13 10.06.2005 150#
1
3col
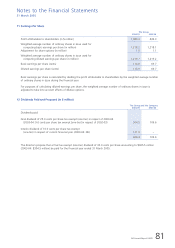
11 Earnings Per Share
The Group
2004-05 2003-04
––––––––––––––––––––––––––––––––––––––––––––––––––––––––––––––––––––––––––––––––––––––––––––––––––––––––––––––––––––––––––––––––––––––––––––––––––
Profit attributable to shareholders (in $ million) 1,389.3 849.3
–––––––––––––––––––––––––––––––––
Weighted average number of ordinary shares in issue used for
computing basic earnings per share (in million) 1,218.2 1,218.1
Adjustment for share options (in million) 1.5 1.1
–––––––––––––––––––––––––––––––––
Weighted average number of ordinary shares in issue used for
computing diluted earnings per share (in million) 1,219.7 1,219.2
–––––––––––––––––––––––––––––––––
Basic earnings per share (cents) 114.0 69.7
–––––––––––––––––––––––––––––––––
Diluted earnings per share (cents) 113.9 69.7
–––––––––––––––––––––––––––––––––
Basic earnings per share is calculated by dividing the profit attributable to shareholders by the weighted average number
of ordinary shares in issue during the financial year.
For purposes of calculating diluted earnings per share, the weighted average number of ordinary shares in issue is
adjusted to take into account effects of dilutive options.
12 Dividends Paid and Proposed (in $ million)
The Group and the Company
2004-05 2003-04
––––––––––––––––––––––––––––––––––––––––––––––––––––––––––––––––––––––––––––––––––––––––––––––––––––––––––––––––––––––––––––––––––––––––––––––––––
Dividends paid:
Final dividend of 25.0 cents per share tax exempt (one-tier) in respect of 2003-04
(2003-04: 9.0 cents per share tax exempt [one-tier] in respect of 2002-03) 304.5 109.6
Interim dividend of 10.0 cents per share tax exempt
(one-tier) in respect of current financial year (2003-04: NIL) 121.9 –
–––––––––––––––––––––––––––––––––
426.4 109.6
–––––––––––––––––––––––––––––––––
The directors propose that a final tax exempt (one-tier) dividend of 30.0 cents per share amounting to $365.5 million
(2003-04: $304.5 million) be paid for the financial year ended 31 March 2005.