Singapore Airlines 2005 Annual Report Download - page 112
Download and view the complete annual report
Please find page 112 of the 2005 Singapore Airlines annual report below. You can navigate through the pages in the report by either clicking on the pages listed below, or by using the keyword search tool below to find specific information within the annual report.-
 1
1 -
2
-
3
-
4
-
5
-
6
-
7
-
8
-
9
-
10
-
11
-
12
-
13
-
14
-
15
-
16
-
17
-
18
-
19
-
20
-
21
-
22
-
23
-
24
-
25
-
26
-
27
-
28
-
29
-
30
-
31
-
32
-
33
-
34
-
35
-
36
-
37
-
38
-
39
-
40
-
41
-
42
-
43
-
44
-
45
-
46
-
47
-
48
-
49
-
50
-
51
-
52
-
53
-
54
-
55
-
56
-
57
-
58
-
59
-
60
-
61
-
62
-
63
-
64
-
65
-
66
-
67
-
68
-
69
-
70
-
71
-
72
-
73
-
74
-
75
-
76
-
77
-
78
-
79
-
80
-
81
-
82
-
83
-
84
-
85
-
86
-
87
-
88
-
89
-
90
-
91
-
92
-
93
-
94
-
95
-
96
-
97
-
98
-
99
-
100
-
101
-
 102
102 -
 103
103 -
 104
104 -
 105
105 -
 106
106 -
 107
107 -
 108
108 -
 109
109 -
 110
110 -
 111
111 -
 112
112 -
 113
113 -
 114
114 -
 115
115 -
 116
116 -
 117
117 -
 118
118 -
 119
119 -
 120
120 -
 121
121 -
 122
122 -
123
-
124
-
125
-
126
-
127
-
128
 |
 |

CC
MOD: CN1323
M Y
C K
While every effort has been taken to carry out instruction to customers satisfaction
NO RESPONSIBILITY liablilty will be accepted for errors
CUSTOMERS ARE THEREFOREURGED TO CHECK THOROUGHLY BEFORE
AUTHORISING PRINTRUNS
DALIM
1 2 3 4 5 6 7 8 9 10 OK TS
CC196777 DLMAC13 10.06.2005 150#
13col
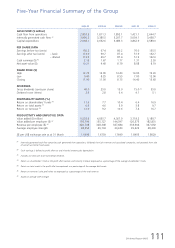
2004-05 2003-04 2002-03 2001-02 2000-01
–––––––––––––––––––––––––––––––––––––––––––––––––––––––––––––––––––––––––––––––––––––––––––––––––––––––––––––––––––––––––––––––––––––––––––––––––––––––––
PROFIT AND LOSS ACCOUNT ($ million)
Total revenue 12,012.9 9,761.9 10,515.0 9,382.8 9,852.2
Total expenditure (10,657.4) (9,081.5) (9,797.9) (8,458.2) (8,584.1)
––––––––––––––––––––––––––––––––––––––––––––––––––––––––––––––––––––––––––––––––––––––––
Operating profit 1,355.5 680.4 717.1 924.6 1,268.1
Finance charges (77.5) (65.1) (54.7) (44.0) (37.5)
Interest income 52.7 32.5 33.7 52.0 86.0
Surplus on disposal of aircraft, spares
and spare engines 215.2 102.7 144.9 66.0 181.3
Surplus on disposal of other fixed assets 8.7 5.5 1.2 2.9 2.4
Dividend from long-term investments, gross 8.0 3.6 5.2 5.7 7.7
Provision for diminution in value of
long-term investments (0.1) (1.8) (9.4) (1.1) (20.5)
Surplus on disposal of long-term investments – – – 4.4 3.0
Amortisation of goodwill on consolidation (0.1) (0.1) – – –
Amortisation of deferred gain 1.3 1.6 – – –
Share of profits of joint venture companies 12.5 6.4 14.5 20.5 27.0
Share of profits/(losses) of associated companies 203.7 86.3 123.8 (71.3) 81.7
––––––––––––––––––––––––––––––––––––––––––––––––––––––––––––––––––––––––––––––––––––––––
Profit before exceptional items 1,779.9 852.0 976.3 959.7 1,599.2
Surplus on sale of investment in
Air New Zealand Limited 45.7 – – – –
Surplus on sale of investment in
Raffles Holdings Ltd 32.6 – – – –
Surplus on sale of investment in Taikoo 9.0 – – – –
Surplus on liquidation of Abacus Distribution
Systems Pte Ltd – 9.2 – – –
Surplus on disposal of Aviation Software
Development Consultancy India Limited – 1.1 – – –
Staff compensation and restructuring of operations (37.8) (41.4) – – –
Surplus on liquidation of Asian Frequent
Flyer Pte Ltd – – 0.5 – –
Gain on sale of long-term investments – – – 30.2 –
Provision for diminution in value of investment in
Air New Zealand Limited – – – (266.9) –
Recognition of deferred gain on
divestment of 51% equity interests in
Eagle Services Asia Private Limited – – – 202.6 –
Profit on disposal of vendor shares (13%
equity interests in SATS and SIAEC) – – – – 440.1
Ex-gratia bonus payment – – – – (134.6)
––––––––––––––––––––––––––––––––––––––––––––––––––––––––––––––––––––––––––––––––––––––––
Profit before taxation 1,829.4 820.9 976.8 925.6 1,904.7
Profit attributable to shareholders 1,389.3 849.3 1,064.8 631.7 1,624.8
–––––––––––––––––––––––––––––––––––––––––––––––––––––––––––––––––––––––––––––––––––––––––––––––––––––––––––––––––––––––––––––––––––––––––––––––––––––––––
BALANCE SHEET ($ million)
Share capital 609.1 609.1 609.1 609.1 1,220.2
Distributable reserves
General reserve 11,263.7 10,282.6 9,539.1 8,655.2 8,215.2
Foreign currency translation reserve 8.8 19.8 41.3 63.8 40.8
Non-distributable reserves
Share premium 448.2 447.2 447.2 447.2 447.2
Capital redemption reserve 64.4 64.4 64.4 64.4 62.3
Capital reserve 41.9 32.0 7.7 6.9 6.9
––––––––––––––––––––––––––––––––––––––––––––––––––––––––––––––––––––––––––––––––––––––––
Shareholders’ funds 12,436.1 11,455.1 10,708.8 9,846.6 9,992.6
–––––––––––––––––––––––––––––––––––––––––––––––––––––––––––––––––––––––––––––––––––––––––––––––––––––––––––––––––––––––––––––––––––––––––––––––––––––––––
Minority interests 303.9 304.1 267.5 228.7 184.5
Deferred account 414.6 446.7 523.1 591.9 733.4
Deferred taxation 2,450.1 2,175.3 2,251.0 2,664.5 2,425.6
Fixed assets 15,304.5 15,222.9 15,406.0 14,442.9 12,863.0
Goodwill on consolidation 1.3 1.4 1.5 – –
Associated companies 790.0 517.5 500.7 385.5 715.4
Joint venture companies 323.6 309.2 296.4 277.1 239.0
Long-term investments 476.3 475.2 569.6 590.4 556.0
Current assets 4,943.9 3,463.8 2,409.8 2,884.5 3,538.5
––––––––––––––––––––––––––––––––––––––––––––––––––––––––––––––––––––––––––––––––––––––––
Total assets 21,839.6 19,990.0 19,184.0 18,580.4 17,911.9
–––––––––––––––––––––––––––––––––––––––––––––––––––––––––––––––––––––––––––––––––––––––––––––––––––––––––––––––––––––––––––––––––––––––––––––––––––––––––
Long-term liabilities 2,333.3 2,207.2 1,879.6 1,928.9 795.5
Current liabilities 3,901.6 3,401.6 3,554.0 3,319.8 3,780.3
––––––––––––––––––––––––––––––––––––––––––––––––––––––––––––––––––––––––––––––––––––––––
Total liabilities 6,234.9 5,608.8 5,433.6 5,248.7 4,575.8
–––––––––––––––––––––––––––––––––––––––––––––––––––––––––––––––––––––––––––––––––––––––––––––––––––––––––––––––––––––––––––––––––––––––––––––––––––––––––
Five-Year Financial Summary of the Group
110 SIA Annual Report 04/05