Singapore Airlines 2005 Annual Report Download - page 115
Download and view the complete annual report
Please find page 115 of the 2005 Singapore Airlines annual report below. You can navigate through the pages in the report by either clicking on the pages listed below, or by using the keyword search tool below to find specific information within the annual report.-
 1
1 -
2
-
3
-
4
-
5
-
6
-
7
-
8
-
9
-
10
-
11
-
12
-
13
-
14
-
15
-
16
-
17
-
18
-
19
-
20
-
21
-
22
-
23
-
24
-
25
-
26
-
27
-
28
-
29
-
30
-
31
-
32
-
33
-
34
-
35
-
36
-
37
-
38
-
39
-
40
-
41
-
42
-
43
-
44
-
45
-
46
-
47
-
48
-
49
-
50
-
51
-
52
-
53
-
54
-
55
-
56
-
57
-
58
-
59
-
60
-
61
-
62
-
63
-
64
-
65
-
66
-
67
-
68
-
69
-
70
-
71
-
72
-
73
-
74
-
75
-
76
-
77
-
78
-
79
-
80
-
81
-
82
-
83
-
84
-
85
-
86
-
87
-
88
-
89
-
90
-
91
-
92
-
93
-
94
-
95
-
96
-
97
-
98
-
99
-
100
-
101
-
102
-
103
-
104
-
 105
105 -
 106
106 -
 107
107 -
 108
108 -
 109
109 -
 110
110 -
 111
111 -
 112
112 -
 113
113 -
 114
114 -
 115
115 -
 116
116 -
 117
117 -
 118
118 -
 119
119 -
 120
120 -
 121
121 -
 122
122 -
 123
123 -
 124
124 -
 125
125 -
126
-
127
-
128
 |
 |
CC
MOD: CN1323
M Y
C K
While every effort has been taken to carry out instruction to customers satisfaction
NO RESPONSIBILITY liablilty will be accepted for errors
CUSTOMERS ARE THEREFOREURGED TO CHECK THOROUGHLY BEFORE
AUTHORISING PRINTRUNS
DALIM
1 2 3 4 5 6 7 8 9 10 OK TS
CC196777 DLMAC13 10.06.2005 150#
1
3col
SIA Annual Report 04/05 113
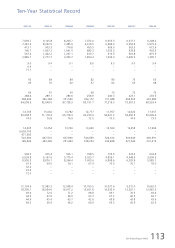
Ten-Year Statistical Record
2004-05 2003-04 2002-03 2001-02 2000-01 1999-00 1998-99 1997-98 1996-97 1995-96
––––––––––––––––––––––––––––––––––––––––––––––––––––––––––––––––––––––––––––––––––––––––––––––––––––––––––––––––––––––––––––––––––––––––––––––––––––––––––––––––––––––––––––––––––––––––––––––––––––––––––––––––––––––––––––––––––––––––––––––––––––––––––––––––––––––––––––––––––––––––––––––––––––––––––––––––––––––––––––––––––––––––––––––––––––
SIA
FINANCIAL R1
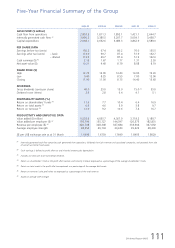
Total revenue ($ million) 9,260.1 7,187.6 8,047.0 7,694.7 9,125.8 8,200.7 7,072.0 6,953.5 6,517.1 6,248.2
Total expenditure ($ million) 8,536.7 7,037.4 7,838.0 7,281.6 8,222.5 7,485.9 6,616.5 6,284.0 5,953.8 5,575.6
Operating profit ($ million) 723.4 150.2 209.0 413.1 903.3 714.8 455.5 669.5 563.3 672.6
Profit before taxation ($ million) 1,595.9 328.4 460.1 740.7 1,607.2 1,641.5 882.3 1,032.3 933.8 903.3
Profit after taxation ($ million) 1,309.1 429.3 618.0 567.2 1,422.2 1,267.1 813.7 919.5 901.8 875.9
Capital disbursements R2 ($ million) 1,608.9 2,051.3 2,766.2 2,885.7 2,777.7 3,303.7 1,850.4 1,934.0 2,365.9 1,395.1
Passenger – yield (cents/pkm) 10.1 9.2 9.1 9.0 9.4 9.1 8.6 9.5 9.0 9.4
– unit cost (cents/ask) 7.0 6.7 6.7 6.4 – – – – – –
– breakeven load factor (%) 69.3 72.8 73.6 71.1 – – – – – –
OPERATING PASSENGER FLEET
Aircraft (numbers) 89 85 96 92 84 84 82 80 73 65
Average age (months) 64 60 71 69 70 62 57 62 63 68
PASSENGER PRODUCTION
Destination cities (numbers) 59 56 60 64 67 69 68 73 72 73
Distance flown (million km) 325.4 266.7 296.2 288.4 289.1 280.6 258.9 240.3 223.1 203.5
Time flown (hours) 419,925 342,715 384,652 368,204 366,784 351,560 334,172 311,388 293,565 267,680
Available seat-km (million) 104,662.3 88,252.7 99,565.9 94,558.5 92,648.0 87,728.3 83,191.7 77,219.3 73,507.3 68,529.4
TRAFFIC
Passengers carried (‘000) 15,944 13,278 15,326 14,765 15,002 13,782 12,777 11,957 12,022 11,057
Revenue passenger-km (million) 77,593.7 64,685.2 74,183.2 69,994.5 71,118.4 65,718.4 60,299.9 54,441.2 54,692.5 50,045.4
Passenger load factor (%) 74.1 73.3 74.5 74.0 76.8 74.9 72.5 70.5 74.4 73.0
STAFF
Average strength (numbers) 13,572 14,010 14,418 14,205 14,254 13,720 13,690 13,506 13,258 12,966
Seat capacity per employee R3 (seat-km) 7,711,634 6,299,265 6,905,667 6,656,705 – – – – – –
Passenger load carried per employee R4 (tonne-km) 549,904 448,513 495,617 471,300 – – – – – –
Revenue per employee ($) 682,294 513,034 558,122 541,690 647,516 607,966 526,859 524,012 500,649 490,591
Value added per employee ($) 301,024 179,272 191,566 189,806 284,369 291,494 228,254 236,828 221,044 210,319
SIA CARGO
Cargo and mail carried (million kg) 1,149.5 1,050.9 1,043.2 938.5 975.4 905.1 768.5 735.9 674.2 603.8
Cargo load (million tonne-km) 7,333.2 6,749.4 6,913.6 6,039.8 6,167.6 5,775.4 5,025.7 4,859.1 4,348.6 3,909.5
Gross capacity (million tonne-km) 11,544.1 10,156.5 9,927.1 8,950.3 8,876.1 8,244.4 7,403.6 6,908.6 6,203.9 5,585.1
Cargo load factor (%) 63.5 66.5 69.6 67.5 69.5 70.1 67.9 70.3 70.1 70.0
Cargo yield (cents/ltk) 35.9 33.1 34.2 32.2 – – – – – –
Cargo unit cost (cents/ctk) 21.3 20.6 23.9 23.2 – – – – – –
Cargo breakeven load factor (%) 59.3 62.2 69.9 72.0 – – – – – –
SIA AND SIA CARGO
Overall load (million tonne-km) 14,796.5 13,033.1 14,059.5 12,734.6 12,985.3 12,038.4 10,765.5 10,037.6 9,512.0 8,662.0
Overall capacity (million tonne-km) 21,882.5 18,873.8 19,773.7 18,305.1 18,034.0 16,917.2 15,651.8 14,533.9 13,501.1 12,481.3
Overall load factor (%) 67.6 69.1 71.1 69.6 72.0 71.2 68.8 69.1 70.5 69.4
Overall yield (cents/ltk) 70.8 63.0 64.5 64.9 67.9 66.0 63.7 67.2 66.5 69.7
Overall unit cost (cents/ctk) 44.4 42.1 45.5 44.9 45.4 43.7 42.6 43.8 43.8 43.6
Overall breakeven load factor (%) 62.7 66.8 70.5 69.2 66.9 66.2 66.9 65.2 65.9 62.6
R1 SIA Cargo was corporatised on 1 July 2001. Statistics for 2000-01 and prior years show the combined numbers of both passenger and cargo operations.
Statistics for 2001-02 includes cargo operations for the first three months only (April to June 2001).
R2 Capital disbursements comprised capital expenditure, investments in joint venture, subsidiary and associated companies, and additional long-term investments.
R3 Seat capacity per employee is available seat capacity divided by SIA average staff strength.
R4 Passenger load carried per employee is defined as passenger load and excess baggage carried divided by SIA average staff strength.