Singapore Airlines 2005 Annual Report Download - page 50
Download and view the complete annual report
Please find page 50 of the 2005 Singapore Airlines annual report below. You can navigate through the pages in the report by either clicking on the pages listed below, or by using the keyword search tool below to find specific information within the annual report.-
 1
1 -
2
-
3
-
4
-
5
-
6
-
7
-
8
-
9
-
10
-
11
-
12
-
13
-
14
-
15
-
16
-
17
-
18
-
19
-
20
-
21
-
22
-
23
-
24
-
25
-
26
-
27
-
28
-
29
-
30
-
31
-
32
-
33
-
34
-
35
-
36
-
37
-
38
-
39
-
 40
40 -
 41
41 -
 42
42 -
 43
43 -
 44
44 -
 45
45 -
 46
46 -
 47
47 -
 48
48 -
 49
49 -
 50
50 -
 51
51 -
 52
52 -
 53
53 -
 54
54 -
 55
55 -
 56
56 -
 57
57 -
 58
58 -
 59
59 -
 60
60 -
61
-
62
-
63
-
64
-
65
-
66
-
67
-
68
-
69
-
70
-
71
-
72
-
73
-
74
-
75
-
76
-
77
-
78
-
79
-
80
-
81
-
82
-
83
-
84
-
85
-
86
-
87
-
88
-
89
-
90
-
91
-
92
-
93
-
94
-
95
-
96
-
97
-
98
-
99
-
100
-
101
-
102
-
103
-
104
-
105
-
106
-
107
-
108
-
109
-
110
-
111
-
112
-
113
-
114
-
115
-
116
-
117
-
118
-
119
-
120
-
121
-
122
-
123
-
124
-
125
-
126
-
127
-
128
 |
 |

Financial Review
48 SIA Annual Report 04/05
CC
MOD: CN1323
M Y
C K
While every effort has been taken to carry out instruction to customers satisfaction
NO RESPONSIBILITY liablilty will be accepted for errors
CUSTOMERS ARE THEREFOREURGED TO CHECK THOROUGHLY BEFORE
AUTHORISING PRINTRUNS
DALIM
1 2 3 4 5 6 7 8 9 10 OK TS
CC196777 DLMAC13 10.06.2005 150#
1
90
75
60
45
30
15
0
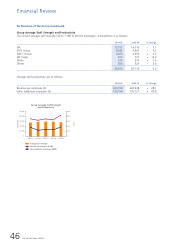
Passenger Load Factor by Route Region
Per Cent
Per Cent
East Americas Europe South West West Asia
Asia Pacific and Africa
2004-05
2003-04
90
75
60
45
30
15
0
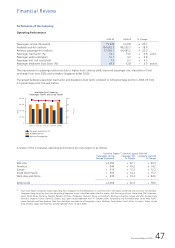
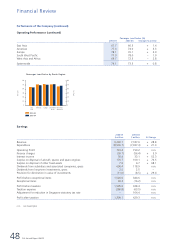
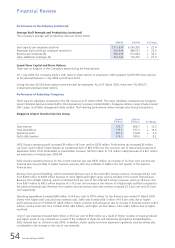
Performance of the Company (continued)
Operating Performance (continued)
Passenger Load Factor (%)
2004-05 2003-04 Change (% points)
–––––––––––––––––––––––––––––––––––––––––––––––––––––––––––––––––––––––––––––––––––––––––––––––––––––––––––––––––––––––––––––––––––––––––––––––––––––––––
East Asia 67.7 66.3 + 1.4
Americas 77.3 74.0 + 3.3
Europe 78.1 76.1 + 2.0
South West Pacific 77.0 78.0 – 1.0
West Asia and Africa 69.7 72.5 – 2.8
––––––––––––––––––––––––––––––––––––––––––––––––––––––––––––
Systemwide 74.1 73.3 + 0.8
–––––––––––––––––––––––––––––––––––––––––––––––––––––––––––––––––––––––––––––––––––––––––––––––––––––––––––––––––––––––––––––––––––––––––––––––––––––––––
Earnings
2004-05 2003-04
$ million $ million % Change
–––––––––––––––––––––––––––––––––––––––––––––––––––––––––––––––––––––––––––––––––––––––––––––––––––––––––––––––––––––––––––––––––––––––––––––––––––––––––
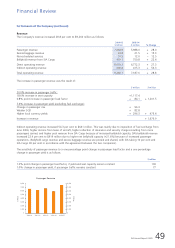
Revenue 9,260.1 7,187.6 + 28.8
Expenditure (8,536.7) (7,037.4) + 21.3
––––––––––––––––––––––––––––––––––––––––––––––––––––
Operating Profit 723.4 150.2 n.m.
Finance charges (59.7) (56.4) + 5.9
Interest income 50.4 33.1 + 52.3
Surplus on disposal of aircraft, spares and spare engines 176.7 100.1 + 76.5
Surplus on disposal of other fixed assets 7.9 4.7 + 68.1
Dividends from subsidiary and associated companies, gross 636.4 118.9 n.m.
Dividends from long-term investments, gross 2.5 2.5 –
Provision for diminution in value of investments (11.0) (8.5) + 29.4
––––––––––––––––––––––––––––––––––––––––––––––––––––
Profit before exceptional items 1,526.6 344.6 n.m.
Exceptional items 69.3 (16.2) n.m.
––––––––––––––––––––––––––––––––––––––––––––––––––––
Profit before taxation 1,595.9 328.4 n.m.
Taxation expense (286.8) (63.5) n.m.
Adjustment for reduction in Singapore statutory tax rate – 164.4 n.m.
––––––––––––––––––––––––––––––––––––––––––––––––––––
Profit after taxation 1,309.1 429.3 n.m.
–––––––––––––––––––––––––––––––––––––––––––––––––––––––––––––––––––––––––––––––––––––––––––––––––––––––––––––––––––––––––––––––––––––––––––––––––––––––––
n.m. not meaningful