Singapore Airlines 2005 Annual Report Download - page 5
Download and view the complete annual report
Please find page 5 of the 2005 Singapore Airlines annual report below. You can navigate through the pages in the report by either clicking on the pages listed below, or by using the keyword search tool below to find specific information within the annual report.-
 1
1 -
 2
2 -
 3
3 -
 4
4 -
 5
5 -
 6
6 -
 7
7 -
 8
8 -
 9
9 -
 10
10 -
 11
11 -
 12
12 -
 13
13 -
 14
14 -
 15
15 -
 16
16 -
17
-
18
-
19
-
20
-
21
-
22
-
23
-
24
-
25
-
26
-
27
-
28
-
29
-
30
-
31
-
32
-
33
-
34
-
35
-
36
-
37
-
38
-
39
-
40
-
41
-
42
-
43
-
44
-
45
-
46
-
47
-
48
-
49
-
50
-
51
-
52
-
53
-
54
-
55
-
56
-
57
-
58
-
59
-
60
-
61
-
62
-
63
-
64
-
65
-
66
-
67
-
68
-
69
-
70
-
71
-
72
-
73
-
74
-
75
-
76
-
77
-
78
-
79
-
80
-
81
-
82
-
83
-
84
-
85
-
86
-
87
-
88
-
89
-
90
-
91
-
92
-
93
-
94
-
95
-
96
-
97
-
98
-
99
-
100
-
101
-
102
-
103
-
104
-
105
-
106
-
107
-
108
-
109
-
110
-
111
-
112
-
113
-
114
-
115
-
116
-
117
-
118
-
119
-
120
-
121
-
122
-
123
-
124
-
125
-
126
-
127
-
128
 |
 |

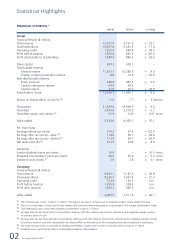
SIA Annual Report 04/05 03
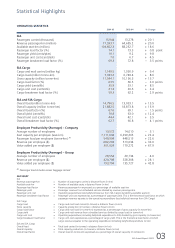
Statistical Highlights
OPERATING STATISTICS
2004-05 2003-04 % Change
SIA
Passengers carried (thousand) 15,944 13,278 + 20.1
Revenue passenger-km (million) 77,593.7 64,685.2 + 20.0
Available seat-km (million) 104,662.3 88,252.7 + 18.6
Passenger load factor (%) 74.1 73.3 + 0.8 point
Passenger yield (cents/pkm) 10.1 9.2 + 9.8
Passenger unit cost (cents/ask) 7.0 6.7 + 4.5
Passenger breakeven load factor (%) 69.3 72.8 – 3.5 points
SIA Cargo
Cargo and mail carried (million kg) 1,149.5 1,050.9 + 9.4
Cargo load (million tonne-km) 7,333.2 6,749.4 + 8.6
Gross capacity (million tonne-km) 11,544.1 10,156.5 + 13.7
Cargo load factor (%) 63.5 66.5 – 3.0 points
Cargo yield (cents/ltk) 35.9 33.1 + 8.5
Cargo unit cost (cents/ctk) 21.3 20.6 + 3.4
Cargo breakeven load factor (%) 59.3 62.2 – 2.9 points
SIA and SIA Cargo
Overall load (million tonne-km) 14,796.5 13,033.1 + 13.5
Overall capacity (million tonne-km) 21,882.5 18,873.8 + 15.9
Overall load factor (%) 67.6 69.1 – 1.5 points
Overall yield (cents/ltk) 70.8 63.0 + 12.4
Overall unit cost (cents/ctk) 44.4 42.1 + 5.5
Overall breakeven load factor (%) 62.7 66.8 – 4.1 points
Employee Productivity (Average) – Company
Average number of employees 13,572 14,010 – 3.1
Seat capacity per employee (seat-km) 7,711,634 6,299,265 + 22.4
Passenger load per employee (tonne-km) R1 549,904 448,513 + 22.6
Revenue per employee ($) 682,294 513,034 + 33.0
Value added per employee ($) 301,024 179,272 + 67.9
Employee Productivity (Average) – Group
Average number of employees 28,554 29,734 – 4.0
Revenue per employee ($) 420,708 328,308 + 28.1
Value added per employee ($) 193,794 135,727 + 42.8
R1 Passenger load includes excess baggage carried.
GLOSSARY
SIA
Revenue passenger-km = Number of passengers carried x distance flown (in km)
Available seat-km = Number of available seats x distance flown (in km)
Passenger load factor = Revenue passenger-km expressed as a percentage of available seat-km
Passenger yield = Passenger revenue from scheduled services divided by revenue passenger-km
Passenger unit cost = Operating expenditure (less bellyhold revenue from SIA Cargo) divided by available seat-km
Passenger breakeven load factor = Passenger unit cost expressed as a percentage of passenger yield. This is the theoretical load factor at which
passenger revenue equates to the operating expenditure (less bellyhold revenue from SIA Cargo)
SIA Cargo
Cargo load = Cargo and mail load carried (in tonnes) x distance flown (in km)
Gross capacity = Capacity production (in tonnes) x distance flown (in km)
Cargo load factor = Cargo and mail load (in tonne-km) expressed as a percentage of gross capacity (in tonne-km)
Cargo yield = Cargo and mail revenue from scheduled services divided by cargo load (in tonne-km)
Cargo unit cost = Operating expenditure (including bellyhold expenditure to SIA) divided by gross capacity (in tonne-km)
Cargo breakeven load factor = Cargo unit cost expressed as a percentage of cargo yield. This is the theoretical load factor at which
cargo revenue equates to the operating expenditure (including bellyhold expenditure to SIA)
SIA and SIA Cargo
Overall load = Total load carried (in tonnes) x distance flown (in km)
Overall capacity = Total capacity production (in tonnes) x distance flown (in km)
Overall load factor = Overall load (in tonne-km) expressed as a percentage of overall capacity (in tonne-km)