Singapore Airlines 2005 Annual Report Download - page 44
Download and view the complete annual report
Please find page 44 of the 2005 Singapore Airlines annual report below. You can navigate through the pages in the report by either clicking on the pages listed below, or by using the keyword search tool below to find specific information within the annual report.-
 1
1 -
2
-
3
-
4
-
5
-
6
-
7
-
8
-
9
-
10
-
11
-
12
-
13
-
14
-
15
-
16
-
17
-
18
-
19
-
20
-
21
-
22
-
23
-
24
-
25
-
26
-
27
-
28
-
29
-
30
-
31
-
32
-
33
-
 34
34 -
 35
35 -
 36
36 -
 37
37 -
 38
38 -
 39
39 -
 40
40 -
 41
41 -
 42
42 -
 43
43 -
 44
44 -
 45
45 -
 46
46 -
 47
47 -
 48
48 -
 49
49 -
 50
50 -
 51
51 -
 52
52 -
 53
53 -
 54
54 -
55
-
56
-
57
-
58
-
59
-
60
-
61
-
62
-
63
-
64
-
65
-
66
-
67
-
68
-
69
-
70
-
71
-
72
-
73
-
74
-
75
-
76
-
77
-
78
-
79
-
80
-
81
-
82
-
83
-
84
-
85
-
86
-
87
-
88
-
89
-
90
-
91
-
92
-
93
-
94
-
95
-
96
-
97
-
98
-
99
-
100
-
101
-
102
-
103
-
104
-
105
-
106
-
107
-
108
-
109
-
110
-
111
-
112
-
113
-
114
-
115
-
116
-
117
-
118
-
119
-
120
-
121
-
122
-
123
-
124
-
125
-
126
-
127
-
128
 |
 |

Financial Review
42 SIA Annual Report 04/05
CC
MOD: CN1323
M Y
C K
While every effort has been taken to carry out instruction to customers satisfaction
NO RESPONSIBILITY liablilty will be accepted for errors
CUSTOMERS ARE THEREFOREURGED TO CHECK THOROUGHLY BEFORE
AUTHORISING PRINTRUNS
DALIM
1 2 3 4 5 6 7 8 9 10 OK TS
CC196777 DLMAC13 10.06.2005 150#
1
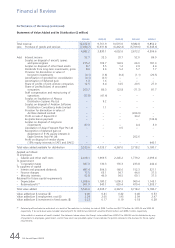
Performance of the Group
Group Earnings
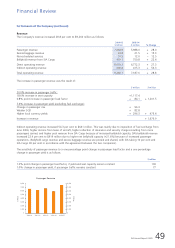
The Group achieved a record operating profit of $1,356 million for the financial year ended 31 March 2005. It nearly
doubled the profit earned in 2003-04 in spite of challenges caused by high fuel prices and intensified regional competition
posed by new airline entrants. Strong passenger and cargo demand underpinned a 23.1 per cent growth (+$2,251 million)
in revenue to $12,013 million, the highest ever. Effective control of costs saw expenditure rise by only 17.4 per cent to
$10,657 million from last year.
Operating performance improved on the back of a strong rebound in demand (up 20.0 per cent in revenue passenger
kilometre) following a reduction in travel the previous year when Severe Acute Respiratory Syndrome (SARS) broke out.
Passenger yield improved 9.8 per cent while unit cost rose at a slower 4.5 per cent from last year.
Profit attributable to shareholders improved $540 million to $1,389 million. A strong operating performance, higher
contributions from the sale of aircraft, share of profits of associated and joint venture companies, and exceptional items
(which include surplus on sale of investment in Air New Zealand, Raffles Holdings and Taikoo, partially offset by expenses
relating to staff compensation and restructuring of operations) contributed to the higher earnings. For perspective, 2003-
04 profit attributable to shareholders was boosted by a tax write-back of $205 million as a result of a reduction in the
Singapore corporate tax rate. No such write-back occurred in 2004-05.
The Group’s earnings per share (basic) rose 44.3 cents to 114.0 cents.
Profitability ratios of the Group are as follows:
2004-05 2003-04 Change
% % % points
––––––––––––––––––––––––––––––––––––––––––––––––––––––––––––––––––––––––––––––––––––––––––––––––––––––––––––––––––––––––––––––––––––––––––––––––––––––––
Return on turnover 12.0 9.2 + 2.8
Return on average total assets 6.9 4.6 + 2.3
Return on average shareholders’ funds 11.6 7.7 + 3.9
––––––––––––––––––––––––––––––––––––––––––––––––––––––––––––––––––––––––––––––––––––––––––––––––––––––––––––––––––––––––––––––––––––––––––––––––––––––––
Group Revenue and Expenditure
$ Million
$ Million
2000-01 2001-02 2002-03 2003-04 2004-05
Revenue
Expenditure
14,000
12,000
10,000
8,000
6,000
4,000
2,000
0
14,000
12,000
10,000
8,000
6,000
4,000
2,000
0
Group Operating Profit, Profit Before Taxation
and Profit Attributable to Shareholders
$ Million
$ Million
2000-01 2001-02 2002-03 2003-04 2004-05
Operating Profit
Profit Before Taxation
Profit Attributable to Shareholders
2,000
1,500
1,000
500
2,000
1,500
1,000
500
Cents
Per cent
2000-01 2001-02 2002-03 2003-04 2004-05
Return on Turnover (%)
Return on Average Shareholders’ Funds (%)
Return on Average Total Assets (%)
Basic Earnings Per Share (¢)
25
20
15
10
5
0
0
30
60
90
120
150
Group Profitability Ratios