Singapore Airlines 2005 Annual Report Download - page 111
Download and view the complete annual report
Please find page 111 of the 2005 Singapore Airlines annual report below. You can navigate through the pages in the report by either clicking on the pages listed below, or by using the keyword search tool below to find specific information within the annual report.-
 1
1 -
2
-
3
-
4
-
5
-
6
-
7
-
8
-
9
-
10
-
11
-
12
-
13
-
14
-
15
-
16
-
17
-
18
-
19
-
20
-
21
-
22
-
23
-
24
-
25
-
26
-
27
-
28
-
29
-
30
-
31
-
32
-
33
-
34
-
35
-
36
-
37
-
38
-
39
-
40
-
41
-
42
-
43
-
44
-
45
-
46
-
47
-
48
-
49
-
50
-
51
-
52
-
53
-
54
-
55
-
56
-
57
-
58
-
59
-
60
-
61
-
62
-
63
-
64
-
65
-
66
-
67
-
68
-
69
-
70
-
71
-
72
-
73
-
74
-
75
-
76
-
77
-
78
-
79
-
80
-
81
-
82
-
83
-
84
-
85
-
86
-
87
-
88
-
89
-
90
-
91
-
92
-
93
-
94
-
95
-
96
-
97
-
98
-
99
-
100
-
 101
101 -
 102
102 -
 103
103 -
 104
104 -
 105
105 -
 106
106 -
 107
107 -
 108
108 -
 109
109 -
 110
110 -
 111
111 -
 112
112 -
 113
113 -
 114
114 -
 115
115 -
 116
116 -
 117
117 -
 118
118 -
 119
119 -
 120
120 -
 121
121 -
122
-
123
-
124
-
125
-
126
-
127
-
128
 |
 |
CC
MOD: CN1323
M Y
C K
While every effort has been taken to carry out instruction to customers satisfaction
NO RESPONSIBILITY liablilty will be accepted for errors
CUSTOMERS ARE THEREFOREURGED TO CHECK THOROUGHLY BEFORE
AUTHORISING PRINTRUNS
DALIM
1 2 3 4 5 6 7 8 9 10 OK TS
CC196777 DLMAC13 10.06.2005 150#
1
3col
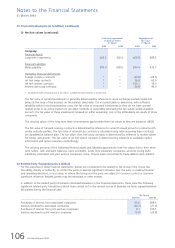
1st Quarter 2nd Quarter 3rd Quarter 4th Quarter Total
––––––––––––––––––––––––––––––––––––––––––––––––––––––––––––––––––––––––––––––––––––––––––––––––––––––––––––––––––––––––––––––––––––––––––––––––––––––––
TOTAL REVENUE
2004-05 ($ million) 2,724.9 3,053.9 3,201.9 3,032.2 12,012.9
2003-04 ($ million) 1,653.4 2,518.1 2,764.4 2,826.0 9,761.9
TOTAL EXPENDITURE
2004-05 ($ million) 2,417.8 2,722.8 2,778.1 2,738.8 10,657.4
2003-04 ($ million) 2,030.7 2,203.3 2,291.2 2,556.3 9,081.5
OPERATING (LOSS)/PROFIT
2004-05 ($ million) 307.1 331.1 423.8 293.4 1,355.5
2003-04 ($ million) (377.3) 314.8 473.2 269.7 680.4
PROFIT/(LOSS) BEFORE TAXATION
2004-05 ($ million) 337.9 446.4 609.9 435.2 1,829.4
2003-04 ($ million) (391.3) 391.8 506.6 313.8 820.9
PROFIT/(LOSS) ATTRIBUTABLE
TO SHAREHOLDERS
2004-05 ($ million) 258.6 357.3 475.6 297.8 1,389.3
2003-04 ($ million) (312.3) 305.8 377.9 477.9 849.3
EARNINGS/(LOSS) (AFTER TAXATION)
PER SHARE – BASIC
2004-05 (cents) 21.2 29.3 39.0 24.4 114.0
2003-04 (cents) (25.6) 25.1 31.0 39.2 69.7
Quarterly Results of the Group
SIA Annual Report 04/05 109