Singapore Airlines 2005 Annual Report Download - page 79
Download and view the complete annual report
Please find page 79 of the 2005 Singapore Airlines annual report below. You can navigate through the pages in the report by either clicking on the pages listed below, or by using the keyword search tool below to find specific information within the annual report.-
 1
1 -
2
-
3
-
4
-
5
-
6
-
7
-
8
-
9
-
10
-
11
-
12
-
13
-
14
-
15
-
16
-
17
-
18
-
19
-
20
-
21
-
22
-
23
-
24
-
25
-
26
-
27
-
28
-
29
-
30
-
31
-
32
-
33
-
34
-
35
-
36
-
37
-
38
-
39
-
40
-
41
-
42
-
43
-
44
-
45
-
46
-
47
-
48
-
49
-
50
-
51
-
52
-
53
-
54
-
55
-
56
-
57
-
58
-
59
-
60
-
61
-
62
-
63
-
64
-
65
-
66
-
67
-
68
-
 69
69 -
 70
70 -
 71
71 -
 72
72 -
 73
73 -
 74
74 -
 75
75 -
 76
76 -
 77
77 -
 78
78 -
 79
79 -
 80
80 -
 81
81 -
 82
82 -
 83
83 -
 84
84 -
 85
85 -
 86
86 -
 87
87 -
 88
88 -
 89
89 -
90
-
91
-
92
-
93
-
94
-
95
-
96
-
97
-
98
-
99
-
100
-
101
-
102
-
103
-
104
-
105
-
106
-
107
-
108
-
109
-
110
-
111
-
112
-
113
-
114
-
115
-
116
-
117
-
118
-
119
-
120
-
121
-
122
-
123
-
124
-
125
-
126
-
127
-
128
 |
 |

CC
MOD: CN1323
M Y
C K
While every effort has been taken to carry out instruction to customers satisfaction
NO RESPONSIBILITY liablilty will be accepted for errors
CUSTOMERS ARE THEREFOREURGED TO CHECK THOROUGHLY BEFORE
AUTHORISING PRINTRUNS
DALIM
1 2 3 4 5 6 7 8 9 10 OK TS
CC196777 DLMAC13 10.06.2005 150#
1
3col
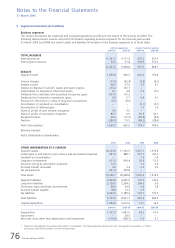
3 Segment Information (in $ million)
Business segments
The Group’s businesses are organised and managed separately according to the nature of the services provided. The
following tables present revenue and profit information regarding business segments for the financial years ended
31 March 2005 and 2004 and certain assets and liabilities information of the business segments as at those dates.
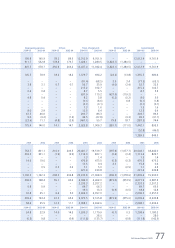
Airline operations Airport terminal services Engineering services Others Total of segments Elimination* Consolidated
2004-05 2003-04 2004-05 2003-04 2004-05 2003-04 2004-05 2003-04 2004-05 2003-04 2004-05 2003-04 2004-05 2003-04
––––––––––––––––––––––––––––––––––––––––––––––––––––––––––––––––––––––––––––––––––––––––––––––––––––––––––––––––––––––––––––––––––––––––––––––––––––––––––––––––––––––––––––––––––––––––––––––––––––––––––––––––––––––––––––––––––––––––––––––––––––––––––––––––––––––––––––––––––––––––––––––––––––––––––––––––––––––––––––––––––––––––––––––––––––––––
TOTAL REVENUE
External revenue 11,341.7 9,171.0 397.2 355.5 195.8 145.9 78.2 89.5 12,012.9 9,761.9 – – 12,012.9 9,761.9
Inter-segment revenue 55.5 57.8 578.5 513.2 611.7 532.8 178.4 176.7 1,424.1 1,280.5 (1,424.1) (1,280.5) – –
–––––––––––––––––––––––––––––––––––––––––––––––––––––––––––––––––––––––––––––––––––––––––––––––––––––––––––––––––––––––––––––––––––––––––––––––––––––––––––––––––––––––––––––––––––––––––––––––––––––––––––––––––––––––––––––––––––––––––––––––––––––
11,397.2 9,228.8 975.7 868.7 807.5 678.7 256.6 266.2 13,437.0 11,042.4 (1,424.1) (1,280.5) 12,012.9 9,761.9
–––––––––––––––––––––––––––––––––––––––––––––––––––––––––––––––––––––––––––––––––––––––––––––––––––––––––––––––––––––––––––––––––––––––––––––––––––––––––––––––––––––––––––––––––––––––––––––––––––––––––––––––––––––––––––––––––––––––––––––––––––––
RESULTS
Segment result 1,055.8 406.3 200.2 190.8 105.5 78.9 18.2 18.2 1,379.7 694.2 (24.2) (13.8) 1,355.5 680.4
Finance charges (77.5) (62.4) (3.9) (6.1) – – – – (81.4) (68.5) 3.9 3.4 (77.5) (65.1)
Interest income 48.9 27.0 3.3 5.1 3.8 3.1 0.7 0.7 56.7 35.9 (4.0) (3.4) 52.7 32.5
Surplus on disposal of aircraft, spares and spare engines 215.2 102.7 – – – – – – 215.2 102.7 – – 215.2 102.7
Surplus/(loss) on disposal of other fixed assets 8.1 4.8 0.2 (0.1) 0.4 0.8 – – 8.7 5.5 – – 8.7 5.5
Dividends from subsidiary and associated companies, gross 637.0 119.2 – – – – – – 637.0 119.2 (637.0) (119.2) – –
Dividends from long-term investments, gross 2.8 2.7 0.6 0.7 4.8 0.4 – – 8.2 3.8 (0.2) (0.2) 8.0 3.6
Provision for diminution in value of long-term investments (0.1) (8.6) – – – – – – (0.1) (8.6) – 6.8 (0.1) (1.8)
Amortisation of goodwill on consolidation – – (0.1) (0.1) – – – – (0.1) (0.1) – – (0.1) (0.1)
Amortisation of deferred gain – – 1.3 1.6 – – – – 1.3 1.6 – – 1.3 1.6
Share of profits of joint venture companies 4.5 3.5 – – 8.0 2.9 – – 12.5 6.4 – – 12.5 6.4
Share of profits of associated companies 85.7 6.6 50.5 33.7 67.5 46.0 – – 203.7 86.3 – – 203.7 86.3
Exceptional items 69.3 (15.3) (28.8) (8.0) 9.0 (3.2) – (1.3) 49.5 (27.8) – (3.3) 49.5 (31.1)
Taxation (389.5) 75.5 (49.2) (28.0) (23.6) 11.1 (4.8) (2.9) (467.1) 55.7 79.8 18.7 (387.3) 74.4
–––––––––––––––––––––––––––––––––––––––––––––––––––––––––––––––––––––––––––––––––––––––––––––––––––––––––––––––––––––––––––––––––––––––––––––––––––––––––––––––––––––––––––––––––––––––––––––––––––––––––––––––––––––––––––––––––––––––––––––––––––––
Profit after taxation 1,660.2 662.0 174.1 189.6 175.4 140.0 14.1 14.7 2,023.8 1,006.3 (581.7) (111.0) 1,442.1 895.3
–––––––––––––––––––––––––––––––––––––––––––––––––––––––––––––––––––––––––––––––––––––––––––––––––––––––––––––––––––––––––––––––––––––––––––––––––––––––––––––––––––––––––––––––––––––––––––––––––––––––––––––––––––––––––
Minority interests (52.8) (46.0)
––––––––––––––––––––––––––––
Profit attributable to shareholders 1,389.3 849.3
––––––––––––––––––––––––––––
2005 2004 2005 2004 2005 2004 2005 2004 2005 2004 2005 2004 2005 2004
––––––––––––––––––––––––––––––––––––––––––––––––––––––––––––––––––––––––––––––––––––––––––––––––––––––––––––––––––––––––––––––––––––––––––––––––––––––––––––––––––––––––––––––––––––––––––––––––––––––––––––––––––––––––––––––––––––––––––––––––––––––––––––––––––––––––––––––––––––––––––––––––––––––––––––––––––––––––––––––––––––––––––––––––––––––––
OTHER INFORMATION AT 31 MARCH
Segment assets 18,223.9 17,192.5 1,215.1 1,319.6 752.7 801.1 210.0 206.5 20,401.7 19,519.7 (397.6) (1,077.7) 20,004.1 18,442.0
Investments in and loans to joint venture and associated companies 451.0 388.7 331.7 141.2 333.2 301.1 (1.9) (3.9) 1,114.0 827.1 (0.4) (0.4) 1,113.6 826.7
Goodwill on consolidation – – 1.3 1.4 – – – – 1.3 1.4 – – 1.3 1.4
Long-term investments 411.3 404.4 50.9 51.5 14.6 19.6 – – 476.8 475.5 (0.5) (0.3) 476.3 475.2
Amounts owing by associated companies 12.5 – 1.0 0.4 – – – – 13.5 0.4 2.3 – 15.8 0.4
Accrued interest receivable 6.6 3.4 0.3 0.9 – 0.5 0.2 0.2 7.1 5.0 – (0.5) 7.1 4.5
Tax prepayments 221.4 239.8 – – – – – – 221.4 239.8 – – 221.4 239.8
–––––––––––––––––––––––––––––––––––––––––––––––––––––––––––––––––––––––––––––––––––––––––––––––––––––––––––––––––––––––––––––––––––––––––––––––––––––––––––––––––––––––––––––––––––––––––––––––––––––––––––––––––––––––––––––––––––––––––––––––––––––
Total assets 19,326.7 18,228.8 1,600.3 1,515.0 1,100.5 1,122.3 208.3 202.8 22,235.8 21,068.9 (396.2) (1,078.9) 21,839.6 19,990.0
–––––––––––––––––––––––––––––––––––––––––––––––––––––––––––––––––––––––––––––––––––––––––––––––––––––––––––––––––––––––––––––––––––––––––––––––––––––––––––––––––––––––––––––––––––––––––––––––––––––––––––––––––––––––––––––––––––––––––––––––––––––
Segment liabilities 4,492.8 4,090.0 191.0 143.4 206.0 168.4 55.1 60.2 4,944.9 4,462.0 (873.0) (874.5) 4,071.9 3,587.5
Long-term liabilities 2,129.0 2,204.2 204.3 3.0 – – – – 2,333.3 2,207.2 – – 2,333.3 2,207.2
Short-term loans and lease commitments 68.0 64.6 0.9 0.8 0.8 0.9 – – 69.7 66.3 – – 69.7 66.3
Accrued interest payable 18.8 13.3 0.5 – – – – – 19.3 13.3 (0.9) (0.5) 18.4 12.8
Tax liabilities 2,434.4 2,189.6 132.7 137.3 32.8 25.1 6.4 5.0 2,606.3 2,357.0 – – 2,606.3 2,357.0
–––––––––––––––––––––––––––––––––––––––––––––––––––––––––––––––––––––––––––––––––––––––––––––––––––––––––––––––––––––––––––––––––––––––––––––––––––––––––––––––––––––––––––––––––––––––––––––––––––––––––––––––––––––––––––––––––––––––––––––––––––––
Total liabilities 9,143.0 8,561.7 529.4 284.5 239.6 194.4 61.5 65.2 9,973.5 9,105.8 (873.9) (875.0) 9,099.6 8,230.8
–––––––––––––––––––––––––––––––––––––––––––––––––––––––––––––––––––––––––––––––––––––––––––––––––––––––––––––––––––––––––––––––––––––––––––––––––––––––––––––––––––––––––––––––––––––––––––––––––––––––––––––––––––––––––––––––––––––––––––––––––––––
Capital expenditure 1,984.4 2,612.6 13.1 33.4 58.4 35.5 12.2 11.1 2,068.1 2,692.6 – – 2,068.1 2,692.6
––––––––––––––––––––––––––––––––––––––––––––––––––––––––––––––––––––––––––––––––––––––––––––––––––––––––––––––––––––––––––––––––––––––––––––––––––––––––––––––––––––––––––––––––––––––––––––––––––––––––––––––––––––––––––––––––––––––––––––––––––––––––––––––––––––––––––––––––––––––––––––––––––––––––––––––––––––––––––––––––––––––––––––––––––––––––
2004-05 2003-04 2004-05 2003-04 2004-05 2003-04 2004-05 2003-04 2004-05 2003-04 2004-05 2003-04 2004-05 2003-04
––––––––––––––––––––––––––––––––––––––––––––––––––––––––––––––––––––––––––––––––––––––––––––––––––––––––––––––––––––––––––––––––––––––––––––––––––––––––––––––––––––––––––––––––––––––––––––––––––––––––––––––––––––––––––––––––––––––––––––––––––––––––––––––––––––––––––––––––––––––––––––––––––––––––––––––––––––––––––––––––––––––––––––––––––––––––
Depreciation 1,107.3 1,081.0 63.2 61.5 24.8 22.9 14.0 14.5 1,209.3 1,179.9 (0.7) 0.3 1,208.6 1,180.2
Impairment – 28.0 – – – – – – – 28.0 – – – 28.0
Non-cash items other than depreciation and impairment (116.6) (148.3) 5.3 3.7 (0.5) 9.8 – (0.9) (111.8) (135.7) – (6.8) (111.8) (142.5)
–––––––––––––––––––––––––––––––––––––––––––––––––––––––––––––––––––––––––––––––––––––––––––––––––––––––––––––––––––––––––––––––––––––––––––––––––––––––––––––––––––––––––––––––––––––––––––––––––––––––––––––––––––––––––––––––––––––––––––––––––––––
* Relates to inter-segment transactions eliminated on consolidation. The Group generally accounts for such inter-segment transactions as if these
transactions were to third parties at current market prices.
SIA Annual Report 04/05 77