Singapore Airlines 2005 Annual Report Download - page 45
Download and view the complete annual report
Please find page 45 of the 2005 Singapore Airlines annual report below. You can navigate through the pages in the report by either clicking on the pages listed below, or by using the keyword search tool below to find specific information within the annual report.-
 1
1 -
2
-
3
-
4
-
5
-
6
-
7
-
8
-
9
-
10
-
11
-
12
-
13
-
14
-
15
-
16
-
17
-
18
-
19
-
20
-
21
-
22
-
23
-
24
-
25
-
26
-
27
-
28
-
29
-
30
-
31
-
32
-
33
-
34
-
 35
35 -
 36
36 -
 37
37 -
 38
38 -
 39
39 -
 40
40 -
 41
41 -
 42
42 -
 43
43 -
 44
44 -
 45
45 -
 46
46 -
 47
47 -
 48
48 -
 49
49 -
 50
50 -
 51
51 -
 52
52 -
 53
53 -
 54
54 -
 55
55 -
56
-
57
-
58
-
59
-
60
-
61
-
62
-
63
-
64
-
65
-
66
-
67
-
68
-
69
-
70
-
71
-
72
-
73
-
74
-
75
-
76
-
77
-
78
-
79
-
80
-
81
-
82
-
83
-
84
-
85
-
86
-
87
-
88
-
89
-
90
-
91
-
92
-
93
-
94
-
95
-
96
-
97
-
98
-
99
-
100
-
101
-
102
-
103
-
104
-
105
-
106
-
107
-
108
-
109
-
110
-
111
-
112
-
113
-
114
-
115
-
116
-
117
-
118
-
119
-
120
-
121
-
122
-
123
-
124
-
125
-
126
-
127
-
128
 |
 |

Financial Review
SIA Annual Report 04/05 43
CC
MOD: CN1323
M Y
C K
While every effort has been taken to carry out instruction to customers satisfaction
NO RESPONSIBILITY liablilty will be accepted for errors
CUSTOMERS ARE THEREFOREURGED TO CHECK THOROUGHLY BEFORE
AUTHORISING PRINTRUNS
DALIM
1 2 3 4 5 6 7 8 9 10 OK TS
CC196777 DLMAC13 10.06.2005 150#
1
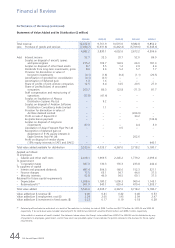
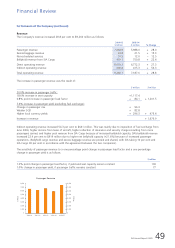
Performance of the Group (continued)
Financial Position of the Group
The Group’s total assets stood at $21,840 million as at 31 March 2005, up 9.3 per cent from a year ago. Net asset value per
share improved 8.6 per cent to $10.21.
Shareholders’ funds of the Group increased 8.6 per cent to $12,436 million as at 31 March 2005.
The Group returned to a net liquid asset R1 position of $923 million from a net debt position of $277 million a year ago. The
turnaround came mainly from a stronger cash position (+$1,322 million), partially offset by the issuance of five-year fixed
rate notes in September 2004 by SATS Group (-$200 million). Total debt to equity ratio improved 0.01 times to 0.19 times.
R1 Net liquid asset is defined as the sum of cash and bank balance (net of bank overdraft), investments in financial instruments, loans to 3rd parties, less
finance lease commitments, loans and fixed rate notes issued.
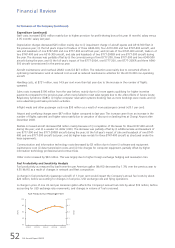
Capital Expenditure and Cash Flow of the Group
Capital expenditure was $2,068 million, 23.2 per cent lower than the year before. Internally generated cash flow of $3,990
million was 1.93 times capital expenditure. About 94 per cent of the capital spending was on aircraft delivered during the
year, together with spare engines and components. In addition, progress payments were made for aircraft scheduled for
delivery between 2005 and 2008.
12
10
8
6
4
2
0
Group Shareholders’ Funds, Total Assets
and Net Asset Value (NAV) Per Share
Dollars
$ Million
2001 2002 2003 2004 2005
31 March
Shareholders’ Funds ($ Million)
Total Assets ($ Million)
NAV Per Share ($)
30,000
25,000
20,000
15,000
10,000
5,000
0
2,000
1,500
1,000
500
0
-500
-1,000
Group Net Liquid Assets and Net Debt
$ Million
$ Million
2001 2002 2003 2004 2005
31 March
Net Liquid Assets
Net Debt
2,000
1,500
1,000
500
0
-500
-1,000
2.0
1.7
1.4
1.1
0.8
0.5
Group Capital Expenditure and
Internally Generated Cash Flow
Ratio
$ Million
Other Capital Expenditure ($ Million)
Capital Expenditure on Aircraft,
Engines and Spares ($ Million)
Internally Generated Cash Flow ($ Million)
Cash Flow: Capital Expenditure Ratio
5,000
4,000
3,000
2,000
1,000
0
2000-01 2001-02 2002-03 2003-04 2004-05