Singapore Airlines 2005 Annual Report Download - page 51
Download and view the complete annual report
Please find page 51 of the 2005 Singapore Airlines annual report below. You can navigate through the pages in the report by either clicking on the pages listed below, or by using the keyword search tool below to find specific information within the annual report.-
 1
1 -
2
-
3
-
4
-
5
-
6
-
7
-
8
-
9
-
10
-
11
-
12
-
13
-
14
-
15
-
16
-
17
-
18
-
19
-
20
-
21
-
22
-
23
-
24
-
25
-
26
-
27
-
28
-
29
-
30
-
31
-
32
-
33
-
34
-
35
-
36
-
37
-
38
-
39
-
40
-
 41
41 -
 42
42 -
 43
43 -
 44
44 -
 45
45 -
 46
46 -
 47
47 -
 48
48 -
 49
49 -
 50
50 -
 51
51 -
 52
52 -
 53
53 -
 54
54 -
 55
55 -
 56
56 -
 57
57 -
 58
58 -
 59
59 -
 60
60 -
 61
61 -
62
-
63
-
64
-
65
-
66
-
67
-
68
-
69
-
70
-
71
-
72
-
73
-
74
-
75
-
76
-
77
-
78
-
79
-
80
-
81
-
82
-
83
-
84
-
85
-
86
-
87
-
88
-
89
-
90
-
91
-
92
-
93
-
94
-
95
-
96
-
97
-
98
-
99
-
100
-
101
-
102
-
103
-
104
-
105
-
106
-
107
-
108
-
109
-
110
-
111
-
112
-
113
-
114
-
115
-
116
-
117
-
118
-
119
-
120
-
121
-
122
-
123
-
124
-
125
-
126
-
127
-
128
 |
 |
Financial Review
SIA Annual Report 04/05 49
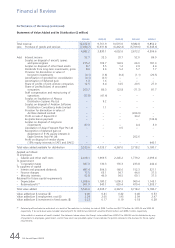
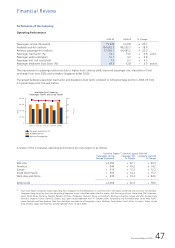
Performance of the Company (continued)
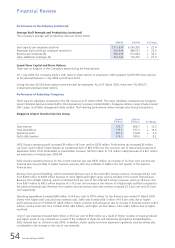
Revenue
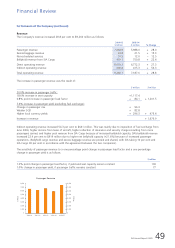
The Company’s revenue increased 28.8 per cent to $9,260 million as follows:
2004-05 2003-04
$ million $ million % Change
–––––––––––––––––––––––––––––––––––––––––––––––––––––––––––––––––––––––––––––––––––––––––––––––––––––––––––––––––––––––––––––––––––––––––––––––––––––––––
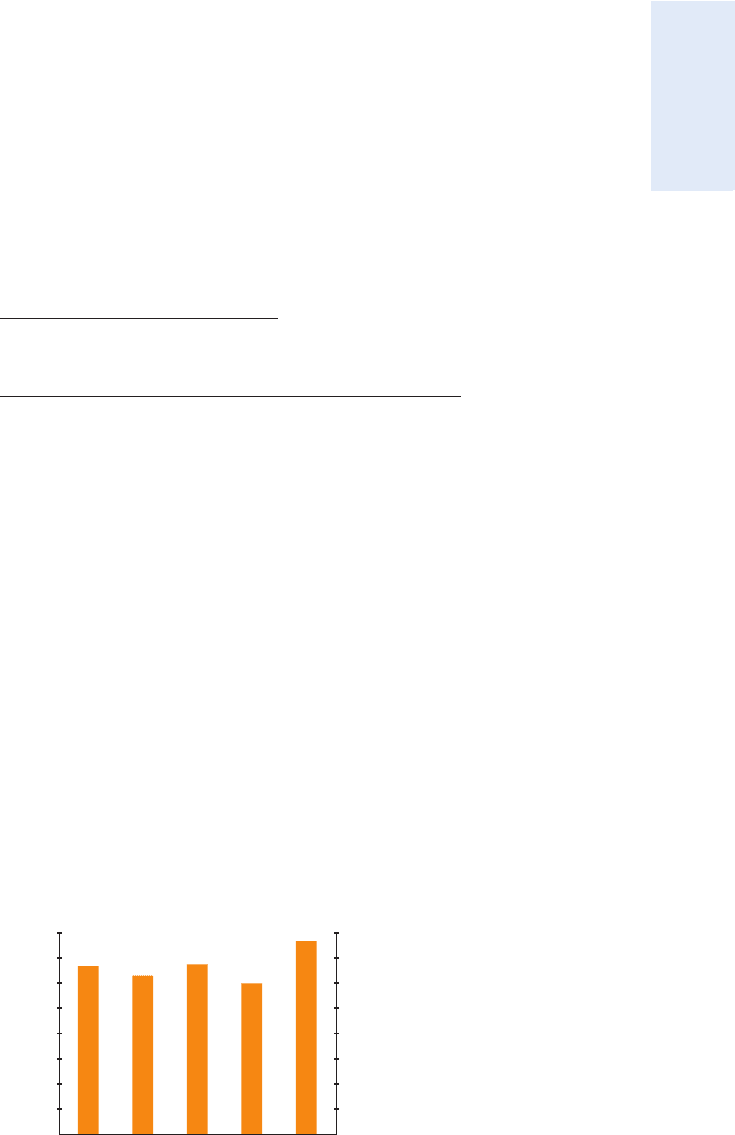
Passenger revenue 7,664.9 5,988.0 + 28.0
Excess baggage revenue 24.8 21.5 + 15.3
Non-scheduled services 10.5 12.0 – 12.5
Bellyhold revenue from SIA Cargo 919.1 750.8 + 22.4
–––––––––––––––––––––––––––––––––––––––––––––––––––
Direct operating revenue 8,619.3 6,772.3 + 27.3
Indirect operating revenue 640.8 415.3 + 54.3
–––––––––––––––––––––––––––––––––––––––––––––––––––
Total operating revenue 9,260.1 7,187.6 + 28.8
–––––––––––––––––––––––––––––––––––––––––––––––––––––––––––––––––––––––––––––––––––––––––––––––––––––––––––––––––––––––––––––––––––––––––––––––––––––––––
The increase in passenger revenue was the result of:
$ million $ million
–––––––––––––––––––––––––––––––––––––––––––––––––––––––––––––––––––––––––––––––––––––––––––––––––––––––––––––––––––––––––––––––––––––––––––––––––––––––––
20.0% increase in passenger traffic:
18.6% increase in seat capacity + 1,117.4
0.8% point increase in passenger load factor + 84.1 + 1,201.5
––––––––––––––––
7.6% increase in passenger yield (excluding fuel surcharge):
Change in passenger mix + 96.3
Weaker SGD + 82.8
Higher local currency yields + 296.3 + 475.4
–––––––––––––––––––––––––––––––––––
Increase in revenue + 1,676.9
–––––––––––––––––––––––––––––––––––––––––––––––––––––––––––––––––––––––––––––––––––––––––––––––––––––––––––––––––––––––––––––––––––––––––––––––––––––––––
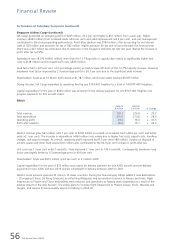
Indirect operating revenue increased 54.3 per cent to $641 million. This was mainly due to imposition of fuel surcharge from
June 2004, higher income from lease of aircraft, higher collection of insurance and security charges resulting from more
passengers carried, and higher pool revenue from SIA Cargo because of increased bellyhold capacity. SIA’s bellyhold revenue
increased 22.4 per cent to $919 million due to higher net bellyhold capacity (+21.6%) because of increased passenger
operations. (Bellyhold cargo revenue and excess baggage revenue are pooled and shared, with SIA taking 10 per cent and
SIA Cargo 90 per cent in accordance with the agreement between the two companies).
The sensitivity of passenger revenue to a one percentage point change in passenger load factor and a one percentage
change in passenger yield is as follows:
$ million
–––––––––––––––––––––––––––––––––––––––––––––––––––––––––––––––––––––––––––––––––––––––––––––––––––––––––––––––––––––––––––––––––––––––––––––––––––––––––
1.0% point change in passenger load factor, if yield and seat capacity remain constant 103
1.0% change in passenger yield, if passenger traffic remains constant 77
–––––––––––––––––––––––––––––––––––––––––––––––––––––––––––––––––––––––––––––––––––––––––––––––––––––––––––––––––––––––––––––––––––––––––––––––––––––––––
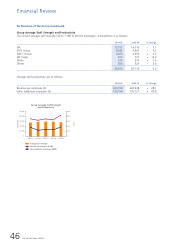
8,000
7,000
6,000
5,000
4,000
3,000
2,000
1,000
0
$ Million
$ Million
2000-01 2001-02 2002-03 2003-04 2004-05
8,000
7,000
6,000
5,000
4,000
3,000
2,000
1,000
0
Passenger Revenue
CC
MOD: CN1323
M Y
C K
While every effort has been taken to carry out instruction to customers satisfaction
NO RESPONSIBILITY liablilty will be accepted for errors
CUSTOMERS ARE THEREFOREURGED TO CHECK THOROUGHLY BEFORE
AUTHORISING PRINTRUNS
DALIM
1 2 3 4 5 6 7 8 9 10 OK TS
CC197302 DLMAC13 20.06.2005 150#
2