Qantas 2014 Annual Report Download - page 9
Download and view the complete annual report
Please find page 9 of the 2014 Qantas annual report below. You can navigate through the pages in the report by either clicking on the pages listed below, or by using the keyword search tool below to find specific information within the annual report.-
 1
1 -
 2
2 -
 3
3 -
 4
4 -
 5
5 -
 6
6 -
 7
7 -
 8
8 -
 9
9 -
 10
10 -
 11
11 -
 12
12 -
 13
13 -
 14
14 -
 15
15 -
 16
16 -
 17
17 -
 18
18 -
 19
19 -
 20
20 -
21
-
22
-
23
-
24
-
25
-
26
-
27
-
28
-
29
-
30
-
31
-
32
-
33
-
34
-
35
-
36
-
37
-
38
-
39
-
40
-
41
-
42
-
43
-
44
-
45
-
46
-
47
-
48
-
49
-
50
-
51
-
52
-
53
-
54
-
55
-
56
-
57
-
58
-
59
-
60
-
61
-
62
-
63
-
64
-
65
-
66
-
67
-
68
-
69
-
70
-
71
-
72
-
73
-
74
-
75
-
76
-
77
-
78
-
79
-
80
-
81
-
82
-
83
-
84
-
85
-
86
-
87
-
88
-
89
-
90
-
91
-
92
-
93
-
94
-
95
-
96
-
97
-
98
-
99
-
100
-
101
-
102
-
103
-
104
-
105
-
106
-
107
-
108
-
109
-
110
-
111
-
112
-
113
-
114
-
115
-
116
-
117
-
118
-
119
-
120
-
121
-
122
-
123
-
124
-
125
-
126
-
127
-
128
-
129
-
130
-
131
-
132
 |
 |

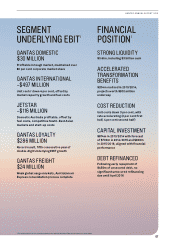
QANTAS DOMESTIC
$30 MILLION
Profitable in tough market, maintained over
80 per cent corporate market share
QANTAS INTERNATIONAL
-$497 MILLION
Unit costs1 down 4 per cent, offset by
market capacity growth and fuel costs
JETSTAR
-$116 MILLION
Domestic Australia profitable, offset by
fuel costs, competitive South-East Asian
markets and start-up costs
QANTAS LOYALTY
$286 MILLION
Record result, fifth consecutive year of
double-digit Underlying EBIT growth
QANTAS FREIGHT
$24 MILLION
Weak global cargo markets, Australian air
Express consolidation process complete
STRONG LIQUIDITY
$3.6bn, including $3 billion cash
ACCELERATED
TRANSFORMATION
BENEFITS
$204m realised in 2013/2014,
projects worth $900 million
underway
COST REDUCTION
Unit costs down 3 per cent, with
rate accelerating (2 per cent first
half, 4 per cent second half)
CAPITAL INVESTMENT
$874m in 2013/2014 with forecast
of $700m in 2014/2015 and $800m
in 2015/2016, aligned with financial
performance
DEBT REFINANCED
Following early repayment of
$450m of unsecured debt, no
significant unsecured refinancing
due until April 2016
SEGMENT
UNDERLYING EBIT1 FINANCIAL
POSITION1
1 For explanations of non-statutory measures, see the Review of Operations section in this report.
07
QANTAS ANNUAL REPORT 2014