Qantas 2014 Annual Report Download - page 11
Download and view the complete annual report
Please find page 11 of the 2014 Qantas annual report below. You can navigate through the pages in the report by either clicking on the pages listed below, or by using the keyword search tool below to find specific information within the annual report.-
 1
1 -
 2
2 -
 3
3 -
 4
4 -
 5
5 -
 6
6 -
 7
7 -
 8
8 -
 9
9 -
 10
10 -
 11
11 -
 12
12 -
 13
13 -
 14
14 -
 15
15 -
 16
16 -
 17
17 -
 18
18 -
 19
19 -
 20
20 -
 21
21 -
 22
22 -
23
-
24
-
25
-
26
-
27
-
28
-
29
-
30
-
31
-
32
-
33
-
34
-
35
-
36
-
37
-
38
-
39
-
40
-
41
-
42
-
43
-
44
-
45
-
46
-
47
-
48
-
49
-
50
-
51
-
52
-
53
-
54
-
55
-
56
-
57
-
58
-
59
-
60
-
61
-
62
-
63
-
64
-
65
-
66
-
67
-
68
-
69
-
70
-
71
-
72
-
73
-
74
-
75
-
76
-
77
-
78
-
79
-
80
-
81
-
82
-
83
-
84
-
85
-
86
-
87
-
88
-
89
-
90
-
91
-
92
-
93
-
94
-
95
-
96
-
97
-
98
-
99
-
100
-
101
-
102
-
103
-
104
-
105
-
106
-
107
-
108
-
109
-
110
-
111
-
112
-
113
-
114
-
115
-
116
-
117
-
118
-
119
-
120
-
121
-
122
-
123
-
124
-
125
-
126
-
127
-
128
-
129
-
130
-
131
-
132
 |
 |

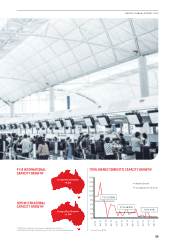
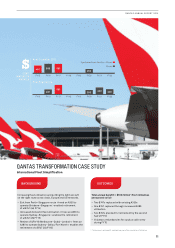
TOTAL MARKET DOMESTIC CAPACITY GROWTH1
1 BITRE (excl. Qantas Group; Qantas modelled for June 2014).
2 OAG Published Flight Schedules as at 1 July 2014 excludes Qantas Group. 1 Sourced from BITRE.
FY14 INTERNATIONAL
CAPACITY GROWTH1
1H15 INTERNATIONAL
CAPACITY GROWTH2
0%
2%
4%
6%
8%
10%
12%
14%
16%
18%
Average Market Growth
Market Growth
Apr 15
Jan 15
Oct 14
Jul 14
Apr 14
Jan 14
Oct 13
Jul 13
Apr 13
Jan 13
Oct 12
Jul 12
FY14 +2.2%
1H15 +1%
FY13 +7.5%
Competitor Growth
+2.4%
Competitor Growth
+9.5%
09
QANTAS ANNUAL REPORT 2014