Qantas 2014 Annual Report Download - page 78
Download and view the complete annual report
Please find page 78 of the 2014 Qantas annual report below. You can navigate through the pages in the report by either clicking on the pages listed below, or by using the keyword search tool below to find specific information within the annual report.-
 1
1 -
2
-
3
-
4
-
5
-
6
-
7
-
8
-
9
-
10
-
11
-
12
-
13
-
14
-
15
-
16
-
17
-
18
-
19
-
20
-
21
-
22
-
23
-
24
-
25
-
26
-
27
-
28
-
29
-
30
-
31
-
32
-
33
-
34
-
35
-
36
-
37
-
38
-
39
-
40
-
41
-
42
-
43
-
44
-
45
-
46
-
47
-
48
-
49
-
50
-
51
-
52
-
53
-
54
-
55
-
56
-
57
-
58
-
59
-
60
-
61
-
62
-
63
-
64
-
65
-
66
-
67
-
 68
68 -
 69
69 -
 70
70 -
 71
71 -
 72
72 -
 73
73 -
 74
74 -
 75
75 -
 76
76 -
 77
77 -
 78
78 -
 79
79 -
 80
80 -
 81
81 -
 82
82 -
 83
83 -
 84
84 -
 85
85 -
 86
86 -
 87
87 -
 88
88 -
89
-
90
-
91
-
92
-
93
-
94
-
95
-
96
-
97
-
98
-
99
-
100
-
101
-
102
-
103
-
104
-
105
-
106
-
107
-
108
-
109
-
110
-
111
-
112
-
113
-
114
-
115
-
116
-
117
-
118
-
119
-
120
-
121
-
122
-
123
-
124
-
125
-
126
-
127
-
128
-
129
-
130
-
131
-
132
 |
 |

76
QANTAS ANNUAL REPORT 2014
NOTES TO THE FINANCIAL STATEMENTS CONTINUED
FOR THE YEAR ENDED 30 JUNE 2014
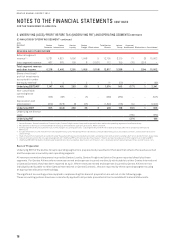
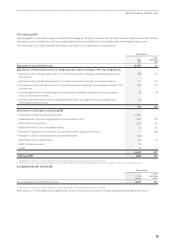
3. UNDERLYING (LOSS)/PROFIT BEFORE TAX (UNDERLYING PBT) AND OPERATING SEGMENTS CONTINUED
(C) ANALYSIS BY OPERATING SEGMENT1 continued
2013
Restated2
$M
Qantas
Domestic
Qantas
International
Qantas
Loyalty
Qantas
Freight Eliminations
Total Qantas
Brands
Jetstar
Group
Corporate/
Unallocated
6
Eliminations
Consolidated
REVENUE AND OTHER INCOME
External segment
revenue3,4 5,731 4,821 1,096 1,048 912,705 3,129 71 (3) 15,902
Inter-segment revenue 487 675 109 8(1,167) 112 159 (70) (201) –
Total segment revenue
and other income 6,218 5,496 1,205 1,056 (1,158) 12,817 3,288 1(204) 15,902
Share of net (loss)/
profit of investments
accounted for under
the equity method55 4 – 2 – 11 (50) – – (39)
Underlying EBITDAR7 1,147 495 263 66 31,974 543 (177) 12,341
Non-cancellable
operating lease
rentals (163) (68) –(5) –(236) (289) – – (525)
Depreciation and
amortisation (619) (673) (3) (25) –(1,320) (116) (14) –(1,450)
Underlying EBIT 365 (246) 260 36 3418 138 (191) 1366
Underlying net finance
costs (180) (180)
Underlying PBT (371) 186
1 Qantas Domestic, Qantas International, Qantas Loyalty, Qantas Freight, Jetstar Group and Corporate/Unallocated are the operating segments of the Qantas Group.
2 Restatement for the impact of revised AASB 119 relating to defined benefit superannuation plans. Refer to Note 38.
3 External segment revenue includes the impact of the change in accounting estimates – passenger revenue of $134million (Qantas Domestic $80million and Qantas International
$54million).
4 Includes settlement income of $125million following the restructure of the Boeing 787 aircraft delivery schedule (reported equally across Qantas Domestic, Qantas International and
Jetstar Group).
5 Share of net profit of investments accounted for under the equity method as reported by Qantas Domestic and Qantas International, before rounding is $4.5million and $4.5million, respectively.
6 Corporate/Unallocated is the only operating segment with Underlying PBT as the primary reporting measure. The primary reporting measure of other segments is Underlying EBIT.
7 Underlying EBITDAR represents Underlying earnings before income tax expense, depreciation, amortisation, non-cancellable aircraft operating lease rentals and net finance costs.
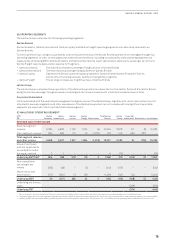
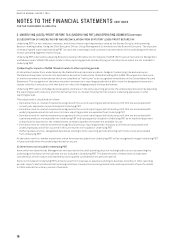
Basis of Preparation
Underlying EBIT of the Qantas Group’s operating segments is prepared and presented on the basis that reflects the revenue earned
and the expenses incurred by each operating segment.
All revenues earned and expenses incurred by Qantas Loyalty, Qantas Freight and Jetstar Group are reported directly by these
segments. For Qantas Airlines where revenues earned and expenses incurred are directly attributable to either Qantas International
or Qantas Domestic they have been reported as such. Where revenues earned and expenses incurred by Qantas Airlines are not
individually attributable to either Qantas International or Qantas Domestic, they are reported by these operating segments using
an appropriate allocation methodology.
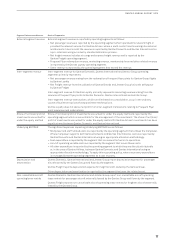
The significant accounting policies applied in implementing this basis of preparation are set out on the following page.
Theseaccounting policies have been consistently applied to all periods presented in the Consolidated Financial Statements.