Qantas 2014 Annual Report Download - page 105
Download and view the complete annual report
Please find page 105 of the 2014 Qantas annual report below. You can navigate through the pages in the report by either clicking on the pages listed below, or by using the keyword search tool below to find specific information within the annual report.-
 1
1 -
2
-
3
-
4
-
5
-
6
-
7
-
8
-
9
-
10
-
11
-
12
-
13
-
14
-
15
-
16
-
17
-
18
-
19
-
20
-
21
-
22
-
23
-
24
-
25
-
26
-
27
-
28
-
29
-
30
-
31
-
32
-
33
-
34
-
35
-
36
-
37
-
38
-
39
-
40
-
41
-
42
-
43
-
44
-
45
-
46
-
47
-
48
-
49
-
50
-
51
-
52
-
53
-
54
-
55
-
56
-
57
-
58
-
59
-
60
-
61
-
62
-
63
-
64
-
65
-
66
-
67
-
68
-
69
-
70
-
71
-
72
-
73
-
74
-
75
-
76
-
77
-
78
-
79
-
80
-
81
-
82
-
83
-
84
-
85
-
86
-
87
-
88
-
89
-
90
-
91
-
92
-
93
-
94
-
 95
95 -
 96
96 -
 97
97 -
 98
98 -
 99
99 -
 100
100 -
 101
101 -
 102
102 -
 103
103 -
 104
104 -
 105
105 -
 106
106 -
 107
107 -
 108
108 -
 109
109 -
 110
110 -
 111
111 -
 112
112 -
 113
113 -
 114
114 -
 115
115 -
116
-
117
-
118
-
119
-
120
-
121
-
122
-
123
-
124
-
125
-
126
-
127
-
128
-
129
-
130
-
131
-
132
 |
 |

103
QANTAS ANNUAL REPORT 2014
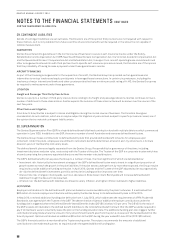
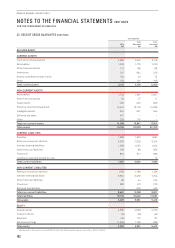
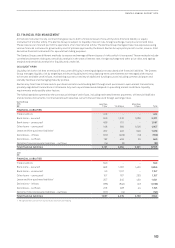
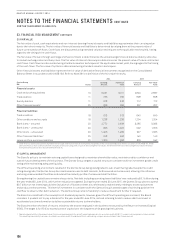
33. FINANCIAL RISK MANAGEMENT
A financial instrument is any contract that gives rise to both a financial asset of one entity and a financial liability or equity
instrument of another entity. The Qantas Group is subject to liquidity, interest rate, foreign exchange, fuel price and credit risks.
These risks are an inherent part of the operations of an international airline. The Qantas Group manages these risk exposures using
various financial instruments, governed by a set of policies approved by the Board. Qantas Group’s policy is not to enter, issue or hold
derivative financial instruments for speculative trading purposes.
The Qantas Group uses different methods to assess and manage different types of risk to which it is exposed. These methods include
correlations between risk types, sensitivity analysis in the case of interest rate, foreign exchange and other price risks, and ageing
analysis and sensitivity analysis for liquidity and credit risk.
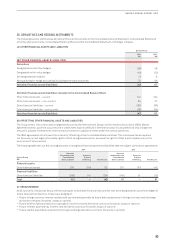
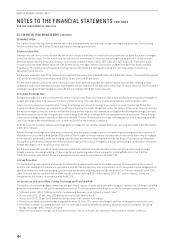
(A) LIQUIDITY RISK
Liquidity risk is the risk that an entity will encounter difficulty in meeting obligations associated with financial liabilities. The Qantas
Group manages liquidity risk by targeting a minimum liquidity level, ensuring long-term commitments are managed with respect
to forecast available cash inflows, maintaining access to a variety of additional funding sources including commercial paper and
standby facilities and managing maturity profiles.
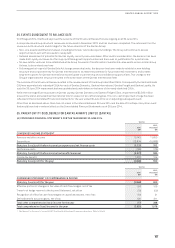
Qantas may from time to time seek to purchase and retire outstanding debt through cash purchases in open market transactions,
privately negotiated transactions or otherwise. Any such repurchases would depend on prevailing market conditions, liquidity
requirements and possibly other factors.
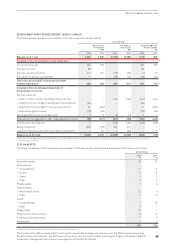
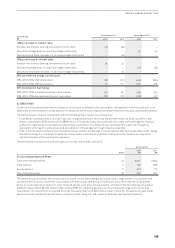
The following tables summarise the contractual timing of cash flows, including estimated interest payments, of financial liabilities
and derivative instruments. Contractual amount assumes current interest rates and foreign exchange rates.
Qantas Group
2014
$M
Less than
1 Year 1 to 5 Years
More than
5 Years Total
FINANCIAL LIABILITIES
Trade creditors 613 – – 613
Bank loans – secured1556 1,616 1,039 3,211
Bank loans – unsecured1486 611 – 1,097
Other loans – unsecured1168 693 1,096 1,957
Lease and hire purchase liabilities1262 402 946 1,610
Derivatives – inflows (122) (409) (19) (550)
Derivatives – outflows 152 459 29 640
Net other financial assets/liabilities – outflows (14) (8) – (22)
Total financial liabilities 2,101 3,364 3,091 8,556
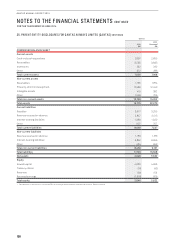
2013
$M
FINANCIAL LIABILITIES
Trade creditors 640 – – 640
Bank loans – secured1663 1,787 1,400 3,850
Bank loans – unsecured150 1,107 –1,157
Other loans – unsecured1107 767 283 1,157
Lease and hire purchase liabilities1257 345 439 1,041
Derivatives – inflows (186) (846) (27) (1,059)
Derivatives – outflows 223 928 44 1,195
Net other financial assets/liabilities – outflows (127) (14) –(141)
Total financial liabilities 1,627 4,074 2,139 7,84 0
1 Recognised financial liability maturity values are shown pre-hedging.