Qantas 2014 Annual Report Download - page 107
Download and view the complete annual report
Please find page 107 of the 2014 Qantas annual report below. You can navigate through the pages in the report by either clicking on the pages listed below, or by using the keyword search tool below to find specific information within the annual report.-
 1
1 -
2
-
3
-
4
-
5
-
6
-
7
-
8
-
9
-
10
-
11
-
12
-
13
-
14
-
15
-
16
-
17
-
18
-
19
-
20
-
21
-
22
-
23
-
24
-
25
-
26
-
27
-
28
-
29
-
30
-
31
-
32
-
33
-
34
-
35
-
36
-
37
-
38
-
39
-
40
-
41
-
42
-
43
-
44
-
45
-
46
-
47
-
48
-
49
-
50
-
51
-
52
-
53
-
54
-
55
-
56
-
57
-
58
-
59
-
60
-
61
-
62
-
63
-
64
-
65
-
66
-
67
-
68
-
69
-
70
-
71
-
72
-
73
-
74
-
75
-
76
-
77
-
78
-
79
-
80
-
81
-
82
-
83
-
84
-
85
-
86
-
87
-
88
-
89
-
90
-
91
-
92
-
93
-
94
-
95
-
96
-
 97
97 -
 98
98 -
 99
99 -
 100
100 -
 101
101 -
 102
102 -
 103
103 -
 104
104 -
 105
105 -
 106
106 -
 107
107 -
 108
108 -
 109
109 -
 110
110 -
 111
111 -
 112
112 -
 113
113 -
 114
114 -
 115
115 -
 116
116 -
 117
117 -
118
-
119
-
120
-
121
-
122
-
123
-
124
-
125
-
126
-
127
-
128
-
129
-
130
-
131
-
132
 |
 |

105
QANTAS ANNUAL REPORT 2014
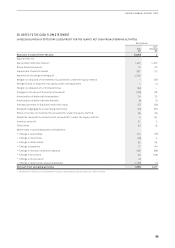
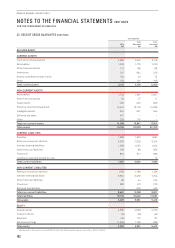
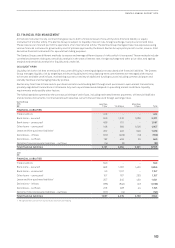
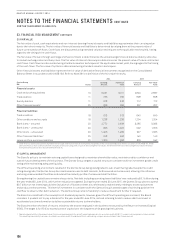
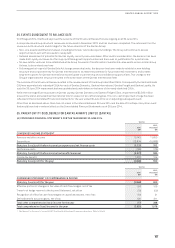
Qantas Group
$M
Profit Before Tax Equity (Before Tax)
2014 2013 2014 2013
100bps increase in interest rates
Variable rate interest-bearing instruments (net of cash) (18) (25) – –
Derivatives designated in a cash flow hedge relationship – – 25 30
Derivatives and fixed rate debt in a fair value hedge relationship –(14) – –
100bps decrease in interest rates
Variable rate interest-bearing instruments (net of cash) 18 25 – –
Derivatives designated in a cash flow hedge relationship – – (26) (32)
Derivatives and fixed rate debt in a fair value hedge relationship –15 – –
20% movement in foreign currency pairs
20% (2013: 20%) USD depreciation (26) (101) (452) (350)
20% (2013: 20%) USD appreciation 19 101 845 728
20% movement in fuel indices
20% (2013: 20%) increase per barrel in fuel indices (51) 60 466 200
20% (2013: 20%) decrease per barrel in fuel indices (80) (70) (122) (51)
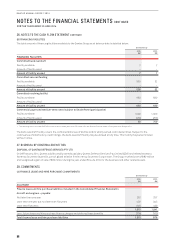
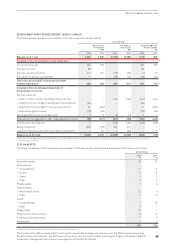
(C) CREDIT RISK
Credit risk is the potential loss from a transaction in the event of default by the counterparty during the term of the transaction or on
settlement of the transaction. Credit exposure is measured as the cost to replace existing transactions should a counterparty default.
The Qantas Group conducts transactions with the following major types of counterparties:
–Trade debtor counterparties: the credit risk is the recognised amount, net of any impairment losses. As at 30 June 2014 trade
debtors amounted to $736million (2013: $898million). The Qantas Group has credit risk associated with travel agents, industry
settlement organisations and credit provided to direct customers. The Qantas Group minimises this credit risk through the
application of stringent credit policies and accreditation of travel agents through industry programs.
–Other financial asset counterparties: the Qantas Group restricts its dealings to counterparties that have acceptable credit ratings.
Should the rating of a counterparty fall below certain levels, internal policy dictates that approval by the Board is required to
maintain the level of the counterparty exposure.
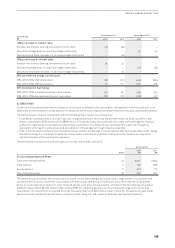
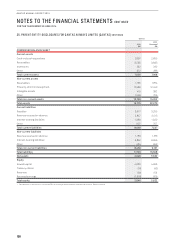
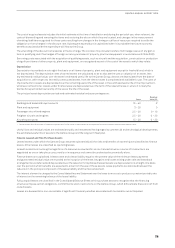
The table below sets out the maximum exposure to credit risk as at 30 June 2014:
Notes
Qantas Group
2014
$M
2013
$M
On Consolidated Balance Sheet
Cash and cash equivalents 10 3,001 2,829
Trade debtors 11 736 898
Sundry debtors 11 618 712
Other financial assets 25 206 207
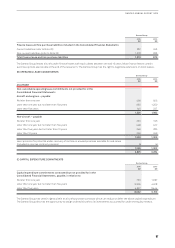
The Qantas Group minimises the concentration of credit risk by undertaking transactions with a large number of customers and
counterparties in various countries in accordance with Board approved policy. As at 30 June 2014, the credit risk of the Qantas
Group to counterparties in relation to other financial assets, cash and cash equivalents, and other financial liabilities amounted
to $3,057million (2013: $3,037million). Refer to Note 25(B) for offsetting disclosures of contractual arrangements. Excluding
receivables from investments accounted for under the equity method of $292million (refer to Note 31), the Qantas Group’s credit
exposure is with counterparties that have a minimum credit rating of A–/A3, unless individually approved by the Board.