Qantas 2014 Annual Report Download - page 83
Download and view the complete annual report
Please find page 83 of the 2014 Qantas annual report below. You can navigate through the pages in the report by either clicking on the pages listed below, or by using the keyword search tool below to find specific information within the annual report.-
 1
1 -
2
-
3
-
4
-
5
-
6
-
7
-
8
-
9
-
10
-
11
-
12
-
13
-
14
-
15
-
16
-
17
-
18
-
19
-
20
-
21
-
22
-
23
-
24
-
25
-
26
-
27
-
28
-
29
-
30
-
31
-
32
-
33
-
34
-
35
-
36
-
37
-
38
-
39
-
40
-
41
-
42
-
43
-
44
-
45
-
46
-
47
-
48
-
49
-
50
-
51
-
52
-
53
-
54
-
55
-
56
-
57
-
58
-
59
-
60
-
61
-
62
-
63
-
64
-
65
-
66
-
67
-
68
-
69
-
70
-
71
-
72
-
 73
73 -
 74
74 -
 75
75 -
 76
76 -
 77
77 -
 78
78 -
 79
79 -
 80
80 -
 81
81 -
 82
82 -
 83
83 -
 84
84 -
 85
85 -
 86
86 -
 87
87 -
 88
88 -
 89
89 -
 90
90 -
 91
91 -
 92
92 -
 93
93 -
94
-
95
-
96
-
97
-
98
-
99
-
100
-
101
-
102
-
103
-
104
-
105
-
106
-
107
-
108
-
109
-
110
-
111
-
112
-
113
-
114
-
115
-
116
-
117
-
118
-
119
-
120
-
121
-
122
-
123
-
124
-
125
-
126
-
127
-
128
-
129
-
130
-
131
-
132
 |
 |
81
QANTAS ANNUAL REPORT 2014
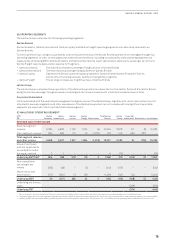
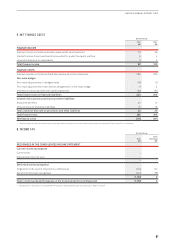
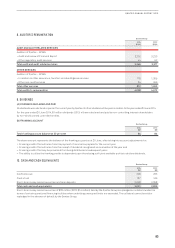
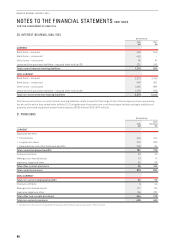
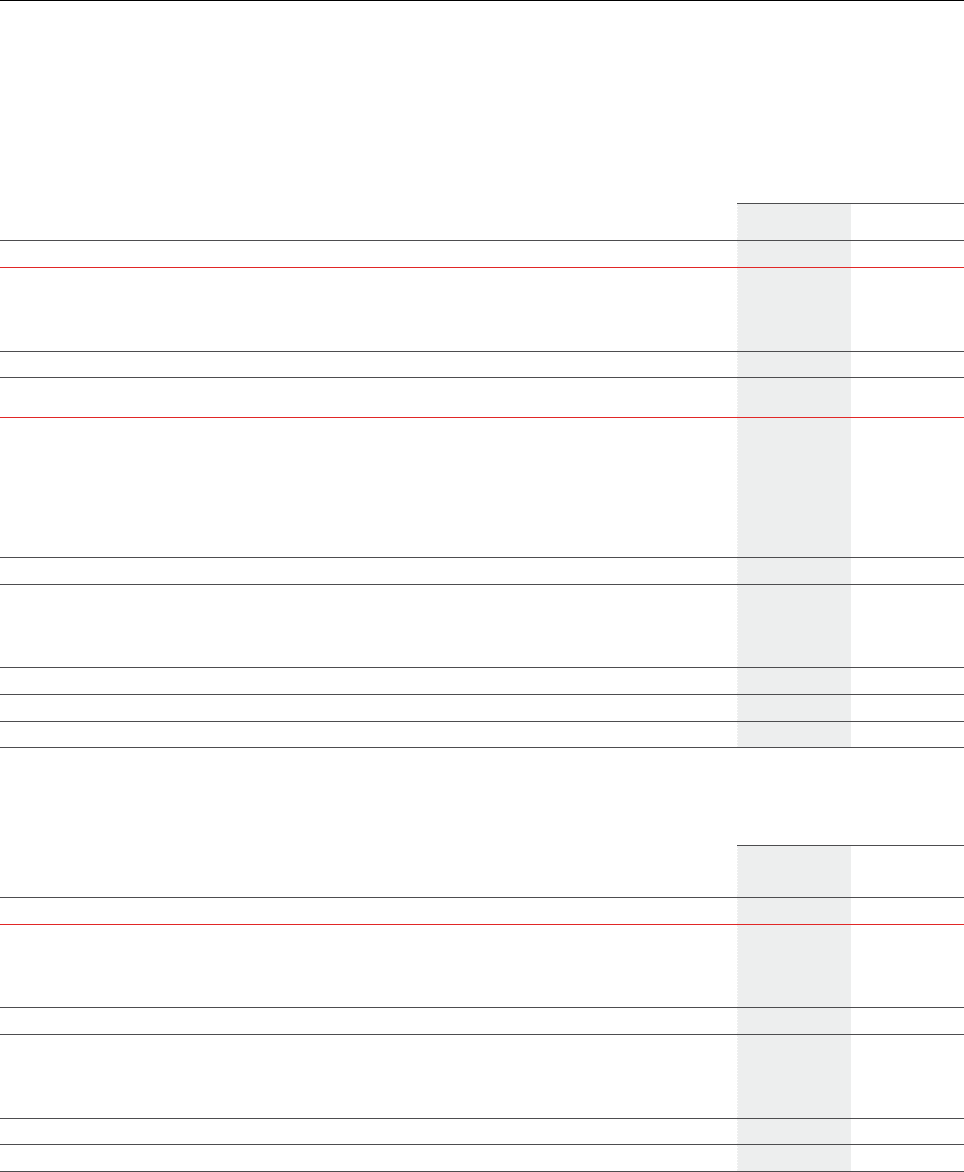
5. NET FINANCE COSTS
Qantas Group
2014
$M
2013
$M
FINANCE INCOME
Interest income on financial assets measured at amortised cost 73 99
Interest income from investments accounted for under the equity method 6 5
Unwind of discount on receivables 3 5
Total finance income 82 109
FINANCE COSTS
Interest expense on financial liabilities measured at amortised cost 280 326
Fair value hedges
Fair value adjustments on hedged items (10) (2)
Fair value adjustments on derivatives designated in a fair value hedge 8 3
Interest paid and capitalised on qualifying assets1(34) (61)
Total finance costs on financial liabilities 244 266
Unwind of discount on provisions and other liabilities
Employee benefits 27 17
Other provisions and other liabilities 15 13
Total unwind of discount on provisions and other liabilities 42 30
Total finance costs 286 296
Net finance costs (204) (187)
1 The borrowing costs are capitalised using the average interest rate applicable to the Qantas Group’s debt facilities being 5.7 per cent (2013: 6.2 per cent).
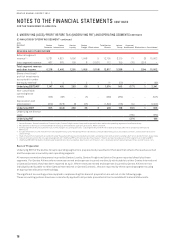
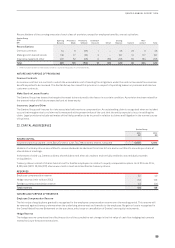
6. INCOME TAX
Qantas Group
2014
$M
2013
Restated1
$M
RECOGNISED IN THE CONSOLIDATED INCOME STATEMENT
Current income tax expense
Current year – –
Adjustments for prior year – –
– –
Deferred income tax expense
Origination and reversal of temporary differences (716) 87
Benefit of tax losses recognised (417) (78)
(1,133) 9
Total income tax (benefit)/expense in the Consolidated Income Statement (1,133) 9
1 Restatement for the impact of revised AASB 119 relating to defined benefit superannuation plans. Refer to Note 38.