Qantas 2014 Annual Report Download - page 31
Download and view the complete annual report
Please find page 31 of the 2014 Qantas annual report below. You can navigate through the pages in the report by either clicking on the pages listed below, or by using the keyword search tool below to find specific information within the annual report.-
 1
1 -
2
-
3
-
4
-
5
-
6
-
7
-
8
-
9
-
10
-
11
-
12
-
13
-
14
-
15
-
16
-
17
-
18
-
19
-
20
-
 21
21 -
 22
22 -
 23
23 -
 24
24 -
 25
25 -
 26
26 -
 27
27 -
 28
28 -
 29
29 -
 30
30 -
 31
31 -
 32
32 -
 33
33 -
 34
34 -
 35
35 -
 36
36 -
 37
37 -
 38
38 -
 39
39 -
 40
40 -
 41
41 -
42
-
43
-
44
-
45
-
46
-
47
-
48
-
49
-
50
-
51
-
52
-
53
-
54
-
55
-
56
-
57
-
58
-
59
-
60
-
61
-
62
-
63
-
64
-
65
-
66
-
67
-
68
-
69
-
70
-
71
-
72
-
73
-
74
-
75
-
76
-
77
-
78
-
79
-
80
-
81
-
82
-
83
-
84
-
85
-
86
-
87
-
88
-
89
-
90
-
91
-
92
-
93
-
94
-
95
-
96
-
97
-
98
-
99
-
100
-
101
-
102
-
103
-
104
-
105
-
106
-
107
-
108
-
109
-
110
-
111
-
112
-
113
-
114
-
115
-
116
-
117
-
118
-
119
-
120
-
121
-
122
-
123
-
124
-
125
-
126
-
127
-
128
-
129
-
130
-
131
-
132
 |
 |

29
QANTAS ANNUAL REPORT 2014
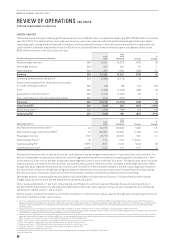
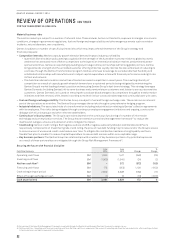
Group comparable unit cost6 improved three per cent compared to the prior year, reflecting the early delivery of benefits from the
accelerated Qantas Transformation program.
Fuel costs increased by six per cent. The increase was driven by an 11 per cent devaluation of the average Australian dollar over the
period, mitigated by the Group’s hedging program and a three per cent improvement in fuel efficiency17 from fleet modernisation,
cabin reconfigurations, and other fuel burn initiatives.
The increase in net finance costs was the result of a reduction in interest income due to lower average deposit rates and a reduced
average cash balance. The average cost of debt did not materially increase over the period following the loss of the Group’s
investment grade credit rating in December 2013.
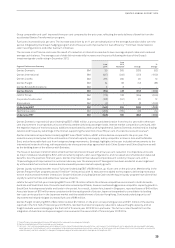
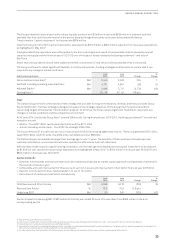
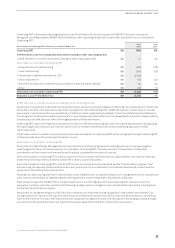
Segment Performance Summary
June
2014
June
2013
Restated7Change
%
Change
Qantas Domestic $M 30 365 (335) (92)
Qantas International $M (497) (246) (251) >(100)
Qantas Loyalty $M 286 260 26 10
Qantas Freight $M 24 36 (12) (33)
Qantas Brands Eliminations $M 3 3 – –
Qantas Brands $M (154) 418 (572) >(100)
Jetstar Group $M (116) 138 (254) >(100)
Corporate/Unallocated $M (168) (191) 23 12
Eliminations $M (2) 1(3) >(100)
Underlying EBIT $M (440) 366 (806) >(100)
Net finance costs $M (206) (180) (26) (14)
Underlying PBT $M (646) 186 (832) >(100)
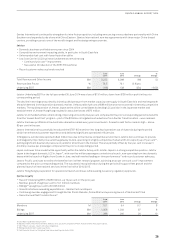
Qantas Domestic reported full-year Underlying EBIT of $30million, a pronounced deterioration from the prior year with a three per
cent improvement in comparable unit cost offset by weaker yield and passenger loads. Intense market competition continued, with
the negative impact of market capacity additions exacerbated by weak underlying demand. Qantas Domestic maintained its leading
network and frequency advantage in the market, supporting the retention of over 80 per cent of corporate account revenue18.
Qantas International reported an Underlying EBIT loss of $497million, a $251million decline compared to the prior year. The
reduction was primarily due to the continuation of market capacity oversupply, led by competitor airlines in Asia and the Middle
East, and unfavourable fuel cost from foreign exchange movements. Strategic highlights in the year included enhancements to the
international network offering, with expanded code share partnerships agreed with both China Eastern and China Southern as well
as the bedding down of the alliance with Emirates.
The focus on business transformation at Qantas International continued, with a four per cent reduction in comparable unit costs
as major initiatives including the B747-400 retirement program, cabin reconfigurations, and increased aircraft utilisation delivered
benefits. Over the past two financial years, Qantas International has reduced comparable unit costs by nine per cent, with a
10percentage point improvement in customer advocacy over the same period. These gains have been eroded at an earnings level
byunfavourable fuel cost and revenue decline caused by excess market capacity growth.
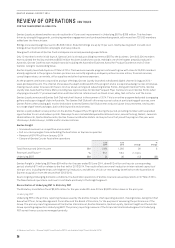
Qantas Loyalty achieved another record3 full-year Underlying EBIT of $286million, up 10 per cent on the prior year. Membership in the
Qantas Frequent Flyer program passed 10million16 in the period, with 14 new partners added to the program, delivering more ways
to earn and increased member interaction. Growth initiatives including Qantas Cash and the Aquire loyalty program have diversified
Loyalty’s customer base and added new revenue streams.
Jetstar Group’s first full-year Underlying EBIT loss of $116million reflects the intense competitive environment in both domestic
Australia and South East Asia. Domestic Australia remained profitable, however sustained aggressive competitor capacity growth in
South East Asia depressed yields and loads in the period. As a result, Jetstar Asia, based in Singapore, reported losses of $40million.
Associate losses of $70million were consistent with the rapid growth of Jetstar Japan as it expanded to consolidate its leading
low-cost carrier position in the Japanese market and the establishment of Jetstar Hong Kong. Continued underlying unit cost19
improvements helped mitigate increased fuel cost of $86million.
Qantas Freight Underlying EBIT of $24million is down $12million on the prior corresponding period, with $11million of the decline
reported in the first half of financial year 2013/2014. Qantas International capacity reductions reduced freight capacity, and air
freight markets were challenging in the first half of financial year 2013/2014 in particular. The full run-rate of benefits from the
integration of Australian air Express began to be received in the second half of financial year 2013/2014.
17 Fuel efficiency is measured as litres per ASK adjusted for movements in average sector length.
18 Qantas modelled share of total corporate account revenue.
19 Unit cost – Unit cost is measured using controllable unit cost in line with industry benchmarks for low-cost carriers. Controllable unit cost is adjusted to aid comparability between
reporting periods. Controllable unit cost is measured as total underlying expenses excluding fuel, carbon tax, Jetstar Group costs and Share of net loss of investments accounted for
under the equity method, adjusted for changes in foreign exchange rates and movements in average sector length per ASK.