Qantas 2014 Annual Report Download - page 48
Download and view the complete annual report
Please find page 48 of the 2014 Qantas annual report below. You can navigate through the pages in the report by either clicking on the pages listed below, or by using the keyword search tool below to find specific information within the annual report.-
 1
1 -
2
-
3
-
4
-
5
-
6
-
7
-
8
-
9
-
10
-
11
-
12
-
13
-
14
-
15
-
16
-
17
-
18
-
19
-
20
-
21
-
22
-
23
-
24
-
25
-
26
-
27
-
28
-
29
-
30
-
31
-
32
-
33
-
34
-
35
-
36
-
37
-
 38
38 -
 39
39 -
 40
40 -
 41
41 -
 42
42 -
 43
43 -
 44
44 -
 45
45 -
 46
46 -
 47
47 -
 48
48 -
 49
49 -
 50
50 -
 51
51 -
 52
52 -
 53
53 -
 54
54 -
 55
55 -
 56
56 -
 57
57 -
 58
58 -
59
-
60
-
61
-
62
-
63
-
64
-
65
-
66
-
67
-
68
-
69
-
70
-
71
-
72
-
73
-
74
-
75
-
76
-
77
-
78
-
79
-
80
-
81
-
82
-
83
-
84
-
85
-
86
-
87
-
88
-
89
-
90
-
91
-
92
-
93
-
94
-
95
-
96
-
97
-
98
-
99
-
100
-
101
-
102
-
103
-
104
-
105
-
106
-
107
-
108
-
109
-
110
-
111
-
112
-
113
-
114
-
115
-
116
-
117
-
118
-
119
-
120
-
121
-
122
-
123
-
124
-
125
-
126
-
127
-
128
-
129
-
130
-
131
-
132
 |
 |

46
QANTAS ANNUAL REPORT 2014
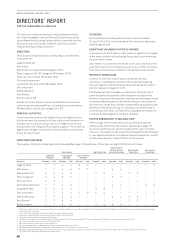
DIRECTORS’ REPORT CONTINUED
FOR THE YEAR ENDED 30 JUNE 2014
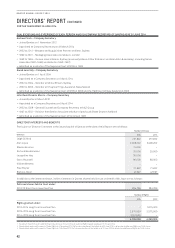
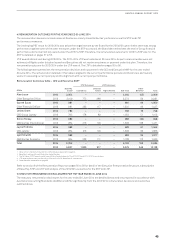
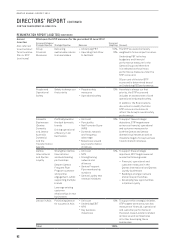
REMUNERATION REPORT (AUDITED) CONTINUED
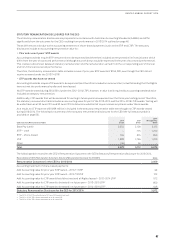
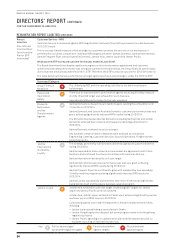
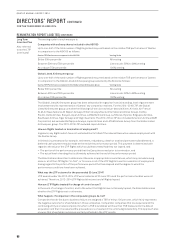
REMUNERATION OUTCOMES FOR THE CEO IN 2013/2014
Mr Joyce’s total remuneration outcome for 2013/2014 was $2million.
The following table outlines the remuneration outcomes for the CEO for 2013/2014.
CEO Remuneration Outcomes1
2014
$’000
2013
$’000
2014
At Target Pay
$’000
2014 as a
Percentage of
At Target pay
%
Base Pay (cash) 2,054 2,109 2,125 97
STIP – cash bonus –775 1,700 0
STIP – deferred award – 388 850 0
LTIP – – 1,700 0
Other (45) 59 –n/a
Total 2,009 3,331 6,375 32
1 Detail of non-statutory remuneration methodology is explained on page 61.
The remuneration decisions and outcomes detailed in the table
above are particularly useful in assessing the CEO’s pay in
2013/2014 and its alignment with Qantas’ performance. That is,
the table reflects:
–No increase in Base Pay and that the CEO elected to forego
five per cent of his Base Pay from 1 January 2014
–No award under the annual incentive for 2013/2014 (under
the 2013/14 STIP)
–The long term incentive (under the 2012–2014 LTIP) did not
vest based on the three year performance period to
30 June 2014
The CEO’s pay is clearly linked to Qantas’ performance. This is
demonstrated by the CEO electing to forego a portion of his Base
Pay from 1 January 2014 and by the performance measures
under both the annual incentive and the long term incentive. This
resulted in his 2013/2014 total remuneration outcome being:
–40 per cent lower than his 2012/2013 outcome, due to the CEO
not receiving a STIP award in 2013/2014
–68 per cent lower than his “at target” pay
Base Pay
Mr Joyce did not receive an increase in Base Pay during
2013/2014 and Mr Joyce elected to forego five per cent of his
Base Pay from 1January 2014.
Base Pay (cash) is Base Pay of $2,125,000 less Base Pay foregone
of $53,125 and less superannuation contributions of $17,775.
Annual Incentive – 2013/14 STIP Outcome
In determining outcomes under the STIP, the Board assesses
performance against financial, safety and other key business
measures
as part of a balanced scorecard, as outlined on pages
52 to 54. While the Board sees this balanced scorecard approach
as an important design element of the STIP, it also recognises
that the overall STIP outcome must be considered in the context
of the Group’s financial performance.
In this regard, whilst satisfied that there has been significant
progress on the transformation agenda and that customer,
operational and safety performance was strong, the Board
considered that the Group’s financial performance did not
warrant any awards under the 2013/14 STIP.
Therefore, the Board determined that no awards will be made
under the 2013/14 STIP.
More detail on the 2013/14 STIP scorecard is provided on pages
52 to 54.
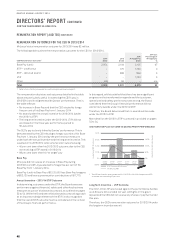
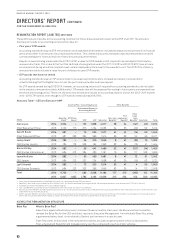
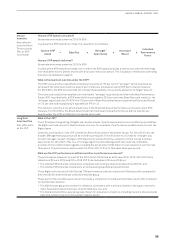
CEO INCENTIVE PLAN OUTCOME VS QANTAS PROFIT PERFORMANCE
$0
$175
$350
$525
$700
0%
50%
100%
150%
Underlying PBT ($ million)
STIP Scorecard Outcome (%)
STIP Scorecard Outcome
Underlying PBT
($500)
$377 $552 $95 $186
($646)
2009/
2010
2008/
2009
2010/
2011
2011/
20121
2012/
2013
2013/
2014
$100
1 The CEO declined his award under the 2011/12 STIP in 2011/2012 despite the STIP
scorecard outcome being 27 per cent.
Long Term Incentive – LTIP Outcome
The 2012–2014 LTIP was tested against the performance hurdles
as at 30 June 2014 and did not vest. All Rights in this grant
lapsed and the CEO did not receive any shares or payment under
this plan.
Therefore, the CEO’s remuneration outcome for 2013/2014 under
the long term incentive was nil.