Qantas 2014 Annual Report Download - page 104
Download and view the complete annual report
Please find page 104 of the 2014 Qantas annual report below. You can navigate through the pages in the report by either clicking on the pages listed below, or by using the keyword search tool below to find specific information within the annual report.-
 1
1 -
2
-
3
-
4
-
5
-
6
-
7
-
8
-
9
-
10
-
11
-
12
-
13
-
14
-
15
-
16
-
17
-
18
-
19
-
20
-
21
-
22
-
23
-
24
-
25
-
26
-
27
-
28
-
29
-
30
-
31
-
32
-
33
-
34
-
35
-
36
-
37
-
38
-
39
-
40
-
41
-
42
-
43
-
44
-
45
-
46
-
47
-
48
-
49
-
50
-
51
-
52
-
53
-
54
-
55
-
56
-
57
-
58
-
59
-
60
-
61
-
62
-
63
-
64
-
65
-
66
-
67
-
68
-
69
-
70
-
71
-
72
-
73
-
74
-
75
-
76
-
77
-
78
-
79
-
80
-
81
-
82
-
83
-
84
-
85
-
86
-
87
-
88
-
89
-
90
-
91
-
92
-
93
-
 94
94 -
 95
95 -
 96
96 -
 97
97 -
 98
98 -
 99
99 -
 100
100 -
 101
101 -
 102
102 -
 103
103 -
 104
104 -
 105
105 -
 106
106 -
 107
107 -
 108
108 -
 109
109 -
 110
110 -
 111
111 -
 112
112 -
 113
113 -
 114
114 -
115
-
116
-
117
-
118
-
119
-
120
-
121
-
122
-
123
-
124
-
125
-
126
-
127
-
128
-
129
-
130
-
131
-
132
 |
 |

102
QANTAS ANNUAL REPORT 2014
NOTES TO THE FINANCIAL STATEMENTS CONTINUED
FOR THE YEAR ENDED 30 JUNE 2014
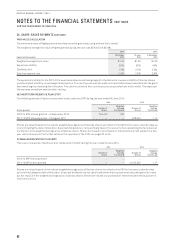
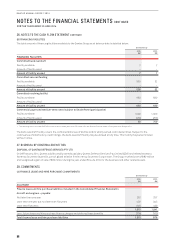
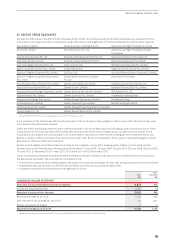
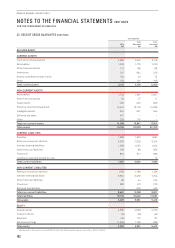
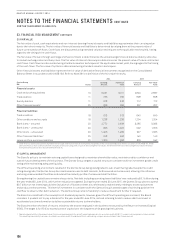
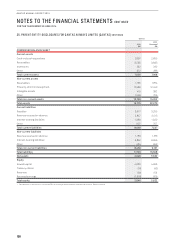
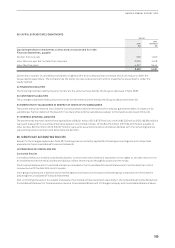
32. DEED OF CROSS GUARANTEE CONTINUED
Consolidated
2014
$M
2013
Restated1
$M
2012
Restated1
$M
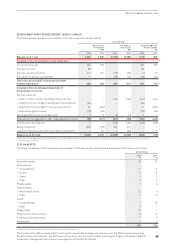
BALANCE SHEET
CURRENT ASSETS
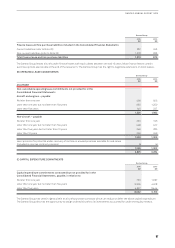
Cash and cash equivalents 2,899 2,693 3,178
Receivables 1,526 1,776 1,229
Other financial assets 172 180 88
Inventories 317 364 376
Assets classified as held for sale 134 42 73
Other 104 101 106
Total current assets 5,152 5,156 5,050
NON-CURRENT ASSETS
Receivables 1,74 3 1,891 2,307
Other financial assets 34 27 17
Investments 430 400 696
Property, plant and equipment 10,447 13,776 14,089
Intangible assets 654 637 544
Deferred tax asset 461 – –
Other 239 116 –
Total non-current assets 14,008 16,847 17,6 53
Total assets 19,160 22,003 22,703
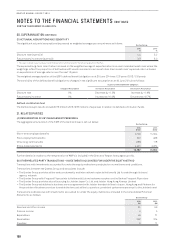
CURRENT LIABILITIES
Payables 1,898 1,922 1,861
Revenue received in advance 3,330 2,959 3,106
Interest-bearing liabilities 1,389 1,020 1,294
Other financial liabilities 182 86 369
Provisions 854 817 838
Liabilities classified as held for sale – – 12
Total current liabilities 7,653 6,804 7,4 8 0
NON-CURRENT LIABILITIES
Revenue received in advance 1,183 1,186 1,136
Interest-bearing liabilities 6,852 6,956 7,25 4
Other financial liabilities 66 54 224
Provisions 380 413 723
Deferred tax liabilities –629 474
Total non-current liabilities 8,481 9,238 9,811
Total liabilities 16,134 16,042 17,291
Net assets 3,026 5,961 5,412
EQUITY
Issued capital 4,630 4,693 4,729
Treasury shares (16) (43) (42)
Reserves (40) 172 87
Retained earnings (1,548) 1,139 638
Total equity 3,026 5,961 5,412
1 Restatement for the impact of revised AASB 119 relating to defined benefit superannuation plans. Refer to Note 38.