Qantas 2014 Annual Report Download - page 29
Download and view the complete annual report
Please find page 29 of the 2014 Qantas annual report below. You can navigate through the pages in the report by either clicking on the pages listed below, or by using the keyword search tool below to find specific information within the annual report.-
 1
1 -
2
-
3
-
4
-
5
-
6
-
7
-
8
-
9
-
10
-
11
-
12
-
13
-
14
-
15
-
16
-
17
-
18
-
 19
19 -
 20
20 -
 21
21 -
 22
22 -
 23
23 -
 24
24 -
 25
25 -
 26
26 -
 27
27 -
 28
28 -
 29
29 -
 30
30 -
 31
31 -
 32
32 -
 33
33 -
 34
34 -
 35
35 -
 36
36 -
 37
37 -
 38
38 -
 39
39 -
40
-
41
-
42
-
43
-
44
-
45
-
46
-
47
-
48
-
49
-
50
-
51
-
52
-
53
-
54
-
55
-
56
-
57
-
58
-
59
-
60
-
61
-
62
-
63
-
64
-
65
-
66
-
67
-
68
-
69
-
70
-
71
-
72
-
73
-
74
-
75
-
76
-
77
-
78
-
79
-
80
-
81
-
82
-
83
-
84
-
85
-
86
-
87
-
88
-
89
-
90
-
91
-
92
-
93
-
94
-
95
-
96
-
97
-
98
-
99
-
100
-
101
-
102
-
103
-
104
-
105
-
106
-
107
-
108
-
109
-
110
-
111
-
112
-
113
-
114
-
115
-
116
-
117
-
118
-
119
-
120
-
121
-
122
-
123
-
124
-
125
-
126
-
127
-
128
-
129
-
130
-
131
-
132
 |
 |

27
QANTAS ANNUAL REPORT 2014
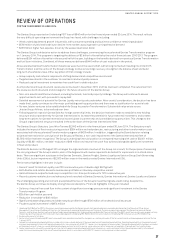
REVIEW OF OPERATIONS
FOR THE YEAR ENDED 30 JUNE 2014
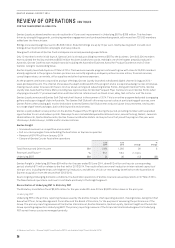
The Qantas Group reported an Underlying PBT1 loss of $646million for the financial year ended 30 June 2014. The result reflects
the very difficult operating environment the Group has faced, with challenges including:
–Weak underlying demand growth in Australia, with consumer spending and business confidence remaining subdued
–$566million of yield and load factor decline from market capacity growth running ahead of demand
–$253million higher fuel expense, driven by the weaker Australian dollar
The Qantas Group took decisive action to address these challenges, commencing the accelerated Qantas Transformation program
on 1 January 2014. This program is targeting the delivery of $2 billion2 of benefits by the end of financial year 2016/2017. The program
delivered $204million of benefits in the second half of the year, building on the benefits derived from previous Qantas Transformation
and fuel burn initiatives. Combined, all these measures delivered $440million of cost reduction in the period.
All accelerated Qantas Transformation milestones were met in the second half, with strong momentum heading into 2014/2015.
Transformation is at the centre of the Group’s strategy to drive an earnings recovery, strengthen the balance sheet and build
long-term shareholder value. Other key pillars of that strategy include:
–Group capacity and network response to shifting demand and competitive environment
–Targeted investment in the customer to maintain brand and yield premium
–Reduced capital investment to maximise free cash flow for debt reduction
A comprehensive Group structural review was announced in December 2013, and has now been completed. The outcomes from
the review are both structural and strategic for the future direction of the Qantas Group:
–Non-core assets identified and valued, including terminals, land and property holdings. The Group will continue to assess
opportunities to sell, with proceeds to repay debt
–Detailed assessment of potential for Qantas Loyalty minority sale undertaken. After careful consideration, the decision has been
made that Loyalty continues to offer major profitable growth opportunities and there was no justification for a partial sale
–No new Jetstar ventures to be established while Group focused on Transformation. Substantial value exists across
Jetstar Group Airlines, to be realised over time
–Following partial repeal of Qantas Sale Act foreign ownership limits, the decision has been made to establish a new holding
structure and corporate entity for Qantas International to increase the potential for future external investment, and creates
long-term options for Qantas International to participate in partnership and consolidation opportunities. This change to the
Group’s organisational structure resulted in the write-down of the Qantas International fleet
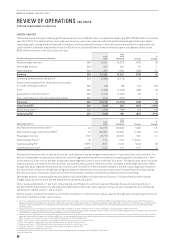
The Qantas Group’s Statutory Loss After Tax was $2,843million for the financial year ended 30 June 2014. The Statutory result
includes the impact of fleet restructuring costs of $394million and redundancies, restructuring and other transformation costs
associated with the accelerated Transformation program of $428million. In addition, triggered by the Board decision relating
to Qantas International on conclusion of the Structural Review, a non-cash impairment of the Qantas International fleet of
$2,560million has been recognised. The Group’s underlying financial position is strong and improving with cash of $3,001million,
liquidity of $3,631million, net debt4 reduction of $96million and neutral free cash flow achieved alongside significant investment
infleet and product.
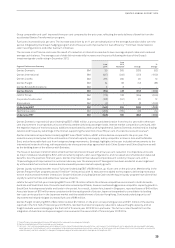
The Board’s decision on 28 August 2014 changes the organisational structure of the Group. As a result, for the purpose of assessing
the carrying value of the Group’s assets, each of the Segments will now be required to be tested for impairment on a stand-alone
basis. There are significant surpluses in the Qantas Domestic, Qantas Freight, Qantas Loyalty and Jetstar Group Cash Generating
Units (CGUs), but an impairment of $2,560million arose in the newly created Qantas International CGU.
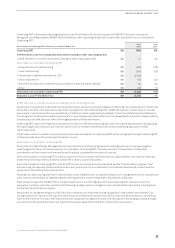
Performance highlights in the year include:
–Record3 result for Qantas Loyalty, and fifth consecutive year of double-digit EBIT growth
–Both Qantas and Jetstar domestic businesses profitable in intensely competitive market
–Qantas Domestic outperformed major competitor in on-time performance for fifth consecutive year
–Record customer satisfaction and advocacy levels reached atQantas Domestic, Qantas International, Qantas Loyalty andJetstar
The challenging operating environment precipitated the loss of the Group’s investment grade credit rating. Despite this,
theQantasGroup continues to display strong financial discipline. Financial highlights in the year included:
–Delivery of neutral free cash flow in the context of significant earnings pressure and significant investment in the Qantas
Transformation Program
–$3 billion cash held at year end
–Reduction in net debt4 of $96million
–Significantly extending unsecured debt maturity profile through $700million of landmark bond issuances
–Prudent capital investment5 of $874million
1 Underlying Profit Before Tax (PBT) is the primary reporting measure used by the Qantas Group’s chief operating decision-making bodies, being the Chief Executive Officer, Group
Management Committee and the Board of Directors, for the purpose of assessing the performance of the Group. The primary reporting measure of the Qantas International, Qantas
Domestic, Jetstar Group, Qantas Loyalty and Qantas Freight operating segments is Underlying Earnings Before Net Finance Costs and Tax (EBIT) as net finance costs are managed centrally.
The primary reporting measure of the Corporate/Unallocated segment is Underlying PBT. Refer to Note 3 for a reconciliation of Underlying PBT to Statutory (Loss)/Profit Before Tax.
2 Excluding the impact of inflation.
3 Qantas Loyalty record Underlying EBIT result compared to prior periods normalised for changes in accounting estimates of the fair value of points and breakage expectations effective
1January 2009.
4 Net debt including operating lease liabilities includes net on balance sheet debt and off balance sheet aircraft operating lease liabilities. Operating lease liability is the present value of
minimum lease payments for aircraft operating leases which, in accordance with AASB 117: Leases, is not recognised on balance sheet. The operating lease liability has been calculated
as the present value of future non-cancellable operating lease rentals of aircraft in service, using a discount rate of seven per cent applied in Standard and Poor’s methodology.
5 Capital investment is net cash from investing activities, net of changes in operating lease liability and including non-cash investing activities. Operating lease liability is the present
value of minimum lease payments for aircraft operating leases which, in accordance with AASB 117: Leases, is not recognised on balance sheet.