Qantas 2014 Annual Report Download - page 101
Download and view the complete annual report
Please find page 101 of the 2014 Qantas annual report below. You can navigate through the pages in the report by either clicking on the pages listed below, or by using the keyword search tool below to find specific information within the annual report.-
 1
1 -
2
-
3
-
4
-
5
-
6
-
7
-
8
-
9
-
10
-
11
-
12
-
13
-
14
-
15
-
16
-
17
-
18
-
19
-
20
-
21
-
22
-
23
-
24
-
25
-
26
-
27
-
28
-
29
-
30
-
31
-
32
-
33
-
34
-
35
-
36
-
37
-
38
-
39
-
40
-
41
-
42
-
43
-
44
-
45
-
46
-
47
-
48
-
49
-
50
-
51
-
52
-
53
-
54
-
55
-
56
-
57
-
58
-
59
-
60
-
61
-
62
-
63
-
64
-
65
-
66
-
67
-
68
-
69
-
70
-
71
-
72
-
73
-
74
-
75
-
76
-
77
-
78
-
79
-
80
-
81
-
82
-
83
-
84
-
85
-
86
-
87
-
88
-
89
-
90
-
 91
91 -
 92
92 -
 93
93 -
 94
94 -
 95
95 -
 96
96 -
 97
97 -
 98
98 -
 99
99 -
 100
100 -
 101
101 -
 102
102 -
 103
103 -
 104
104 -
 105
105 -
 106
106 -
 107
107 -
 108
108 -
 109
109 -
 110
110 -
 111
111 -
112
-
113
-
114
-
115
-
116
-
117
-
118
-
119
-
120
-
121
-
122
-
123
-
124
-
125
-
126
-
127
-
128
-
129
-
130
-
131
-
132
 |
 |

99
QANTAS ANNUAL REPORT 2014
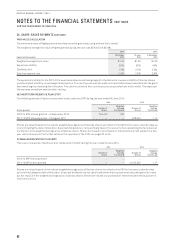
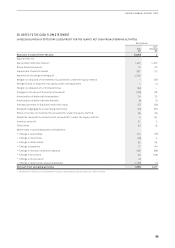
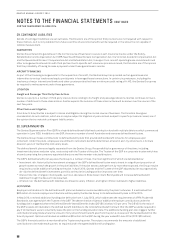
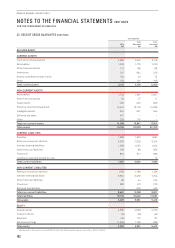
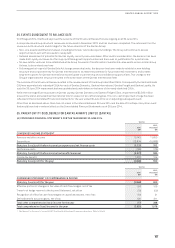
(B) MOVEMENT IN NET DEFINED BENEFIT (ASSET)/LIABILITY
The following table shows a reconciliation of the defined benefit (asset)/liability.
Qantas Group
Present Value
of Obligation
$M
Fair Value of
Plan Assets
$M
Net Defined Benefit
(Asset)/ Liability
$M
2014 2013 2014 2013 2014 2013
Balance as at 1 July 2,223 2,390 (2,339) (2,082) (116) 308
Included in the Consolidated Income Statement
Current service cost 140 159 – – 140 159
Past service cost 361–––36 –
Interest expense/(income) 117 107 (118) (92) (1) 15
Contributions by plan participants – – (23) (25) (23) (25)
Total amount included in manpower and staff
related expenditure 293 266 (141) (117) 152 149
Included in the Consolidated Statement of
Comprehensive Income
Remeasurements:
–Return on plan assets, excluding interest income – – (101) (157) (101) (157)
–(Gain)/loss from change in demographic assumptions (34) –––(34) –
–(Gain)/loss from change in financial assumptions 51 (235) – – 51 (235)
–Experience (gains)/losses (76) (54) – – (76) (54)
Exchange differences on foreign plans 712 (6) (11) 1 1
Total amount recognised in other comprehensive income (52) (277) (107) (168) (159) (445)
Contributions by employer – – (110) (135) (110) (135)
Benefit payments (292) (213) 292 213 – –
Liabilities/(assets) acquired in a business combination –57 –(50) – 7
Balance as at 30 June 2,172 2,223 (2,405) (2,339) (233) (116)
1 Past service cost of $36million for defined benefit curtailment expenses relates to a significant reduction in employees covered by the QSP’s defined benefit plan as a result of
transformation initiatives.
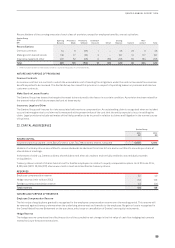
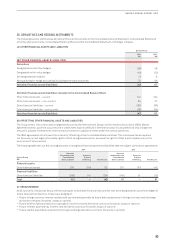
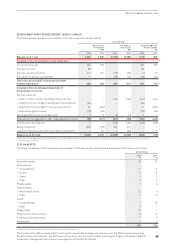
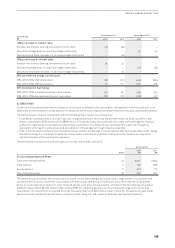
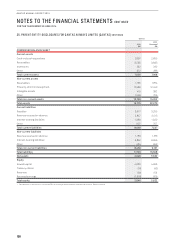
(C) PLAN ASSETS
The major categories of plan assets as a percentage of total plan assets of the Group’s defined benefit plans are as follows:
Qantas Group
2014
%
2013
%
Australian equity118 21
Global equity1
–United States 11 9
–Europe 9 8
–Japan 2 2
–Other 7 7
Private equity 5 4
Fixed interest1
–Government bonds 12 9
–Other 7 9
Credit1
–Corporate debt 710
–Other 2 1
Hedge funds 10 1
Property and infrastructure 9 9
Cash and cash equivalents11 7
Derivatives1– 3
100 100
1 Majority of these plan assets have a quoted market price in an active market.
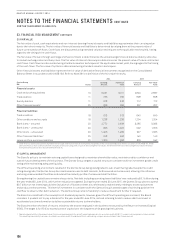
The Trustee of the QSP is responsible for setting the investment strategy and objectives for the QSP’s assets supporting
the defined benefit liabilities. The QSP does not currently use any asset-liability matching strategies. It utilises traditional
investmentmanagement techniques to manage the defined benefit assets.