Qantas 2014 Annual Report Download - page 82
Download and view the complete annual report
Please find page 82 of the 2014 Qantas annual report below. You can navigate through the pages in the report by either clicking on the pages listed below, or by using the keyword search tool below to find specific information within the annual report.-
 1
1 -
2
-
3
-
4
-
5
-
6
-
7
-
8
-
9
-
10
-
11
-
12
-
13
-
14
-
15
-
16
-
17
-
18
-
19
-
20
-
21
-
22
-
23
-
24
-
25
-
26
-
27
-
28
-
29
-
30
-
31
-
32
-
33
-
34
-
35
-
36
-
37
-
38
-
39
-
40
-
41
-
42
-
43
-
44
-
45
-
46
-
47
-
48
-
49
-
50
-
51
-
52
-
53
-
54
-
55
-
56
-
57
-
58
-
59
-
60
-
61
-
62
-
63
-
64
-
65
-
66
-
67
-
68
-
69
-
70
-
71
-
 72
72 -
 73
73 -
 74
74 -
 75
75 -
 76
76 -
 77
77 -
 78
78 -
 79
79 -
 80
80 -
 81
81 -
 82
82 -
 83
83 -
 84
84 -
 85
85 -
 86
86 -
 87
87 -
 88
88 -
 89
89 -
 90
90 -
 91
91 -
 92
92 -
93
-
94
-
95
-
96
-
97
-
98
-
99
-
100
-
101
-
102
-
103
-
104
-
105
-
106
-
107
-
108
-
109
-
110
-
111
-
112
-
113
-
114
-
115
-
116
-
117
-
118
-
119
-
120
-
121
-
122
-
123
-
124
-
125
-
126
-
127
-
128
-
129
-
130
-
131
-
132
 |
 |

80
QANTAS ANNUAL REPORT 2014
NOTES TO THE FINANCIAL STATEMENTS CONTINUED
FOR THE YEAR ENDED 30 JUNE 2014
3. UNDERLYING (LOSS)/PROFIT BEFORE TAX (UNDERLYING PBT) AND OPERATING SEGMENTS CONTINUED
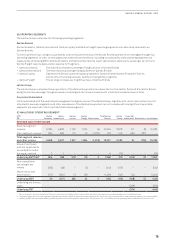
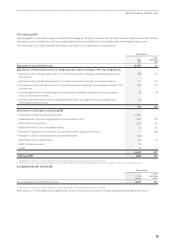
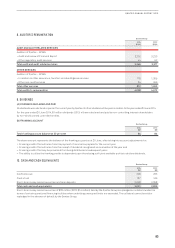
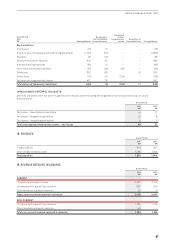
(F) ANALYSIS BY GEOGRAPHICAL AREAS
(i) Revenue and other income by geographic areas
Notes
Qantas Group
2014
$M
2013
$M
Net passenger and freight revenue
Australia 10,558 10,864
Overseas 3,639 3,744
Total net passenger and freight revenue 14,197 14,608
Other revenue/income 41,155 1,294
Total revenue and other income 15,352 15,902
Net passenger and freight revenue is attributed to a geographic region based on the point of sale and, where not directly available,
on a pro-rata basis. Other revenue/income is not allocated to a geographic region as it is impractical to do so.
(ii) Non-current assets by geographic areas
Non-current assets, which consist principally of aircraft supporting the Group’s global operations, are primarily located in Australia.
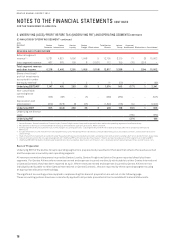
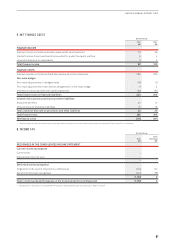
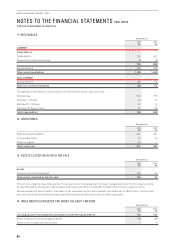
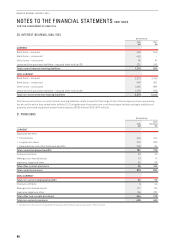
4. OTHER REVENUE/INCOME AND OTHER EXPENDITURE
Notes
Qantas Group
2014
$M
2013
$M
OTHER REVENUE/INCOME
Frequent Flyer marketing revenue, membership fees and other revenue 300 268
Frequent Flyer store and other redemption revenue1275 257
Contract work revenue 227 296
Retail, advertising and other property revenue 156 148
Other 197 325
Total other revenue/income 1,155 1,294
OTHER EXPENDITURE
Selling and marketing 636 598
Computer and communication 394 418
Redundancies2370 92
Capacity hire 331 311
Non-aircraft operating lease rentals 238 229
Property 245 261
Airport security charges 161 145
Inventory write-off 61 5
Contract work materials 57 65
Net gain on sale of investments accounted for under the equity method –(30)
Ineffective and non-designated derivatives (8) 76
Net gain on sale of controlled entity 27 (62) –
Other 426 344
Total other expenditure 2,849 2,514
1 Frequent Flyer redemption revenue excludes redemptions on Qantas Group flights, which are reported as net passenger revenue in the Consolidated Income Statement.
2 Redundancies include defined benefit curtailment expenses of $36million (2013: nil).