Qantas 2014 Annual Report Download - page 35
Download and view the complete annual report
Please find page 35 of the 2014 Qantas annual report below. You can navigate through the pages in the report by either clicking on the pages listed below, or by using the keyword search tool below to find specific information within the annual report.-
 1
1 -
2
-
3
-
4
-
5
-
6
-
7
-
8
-
9
-
10
-
11
-
12
-
13
-
14
-
15
-
16
-
17
-
18
-
19
-
20
-
21
-
22
-
23
-
24
-
 25
25 -
 26
26 -
 27
27 -
 28
28 -
 29
29 -
 30
30 -
 31
31 -
 32
32 -
 33
33 -
 34
34 -
 35
35 -
 36
36 -
 37
37 -
 38
38 -
 39
39 -
 40
40 -
 41
41 -
 42
42 -
 43
43 -
 44
44 -
 45
45 -
46
-
47
-
48
-
49
-
50
-
51
-
52
-
53
-
54
-
55
-
56
-
57
-
58
-
59
-
60
-
61
-
62
-
63
-
64
-
65
-
66
-
67
-
68
-
69
-
70
-
71
-
72
-
73
-
74
-
75
-
76
-
77
-
78
-
79
-
80
-
81
-
82
-
83
-
84
-
85
-
86
-
87
-
88
-
89
-
90
-
91
-
92
-
93
-
94
-
95
-
96
-
97
-
98
-
99
-
100
-
101
-
102
-
103
-
104
-
105
-
106
-
107
-
108
-
109
-
110
-
111
-
112
-
113
-
114
-
115
-
116
-
117
-
118
-
119
-
120
-
121
-
122
-
123
-
124
-
125
-
126
-
127
-
128
-
129
-
130
-
131
-
132
 |
 |

33
QANTAS ANNUAL REPORT 2014
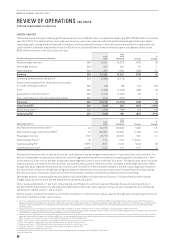
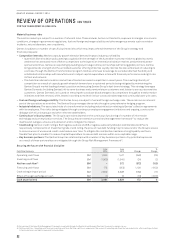
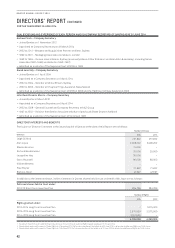
The Group ended the financial year with a robust liquidity position, with $3 billion in cash and $630million in undrawn facilities
available. Net free cash flow was neutral in the period, despite the significant early cash costs associated with Qantas
Transformation. Capital investment5 for the year was $874million.
Total financial year 2014/2015 capital investment is expected to be $700million, a $600million reduction from previous expectations
as highlighted in May 201427.
Cash generated from operations was unfavourable to the prior year largely as a result of revenue deterioration caused by market
capacity oversupply and the financial year 2012/2013 one-off receipt of funds related to the Boeing settlement15 and sale of
StarTrack.
Seven new unencumbered aircraft were added to the fleet, and another 15 mid-life aircraft became debt free in the period.
The Group continues to retain significant flexibility in its financial position, funding strategies and fleet plan to ensure that it can
respond to any change in market conditions.
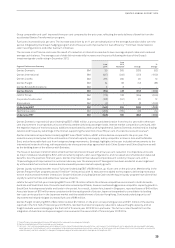
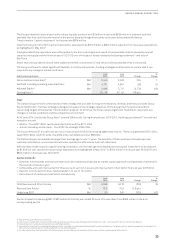
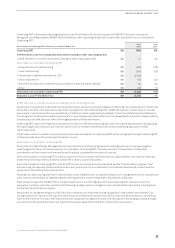
Debt and Gearing Analysis
June
2014
June
2013 Change
%
Change
Net on balance sheet debt28 $M 3,455 3,226 229 7
Net Debt including operating lease liabilities4$M 4,751 4,847 (96) (2)
Adjusted Equity29 $M 2,938 5,717 (2,779) (49)
Gearing Ratio30 62 : 38 46 : 54 (16) pts
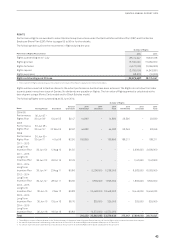
Fleet
The Qantas Group remains committed to a fleet strategy that provides for long-term flexibility, renewal, and that prioritises Group
fleet simplification. The fleet strategy is designed to support the strategic objectives of the Group’s two flying brands and the
overarching targets of the Qantas Transformation program. At all times, the Group retains significant flexibility to respond to any
changes in market conditions and the competitive environment.
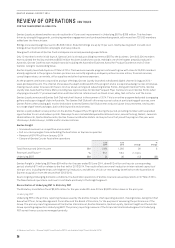
At 30 June 2014, the Qantas Group fleet31 totalled 308 aircraft. During financial year 2013/2014, the Group purchased 17 aircraft and
leased six aircraft:
–Qantas – four B737-800s, two Bombardier Q400s and five B717-200s
–Jetstar (including Jetstar Asia) – four B787-8s and eight A320-200s
The Group removed 27 aircraft from service in financial year 2013/2014 including eight lease returns. These included three B747-400s,
seven B767-300s, six B737-400s, five A320-200s, two Q200s and four EMB120s.
The Qantas Group’s scheduled passenger fleet average age is now 7.7 years. The benefits of fleet investment include improved
customer satisfaction, environmental outcomes, operational efficiencies and cost reductions.
With the fleet modernisation program nearing completion, the low fleet age has enabled planned capital investment5 to be reduced
by $1.3 billion over two years from previous expectations as highlighted in May 201427 to $700million in financial year 2014/2015 and
$800million in financial year 2015/2016.
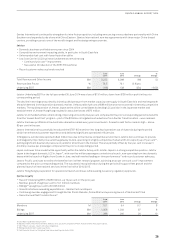
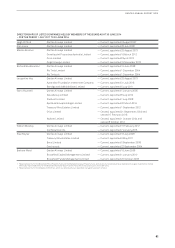
Qantas Domestic
–Domestic market yields and revenue seat factor were adversely impacted by market capacity growth running ahead of demand for
the second consecutive year
–Comparable unit cost improvement of three per cent, up from one per cent improvement in first half of financial year 2013/2014
–Superior on-time performance: market leader in 12 out of 12 months
–Record levels of customer satisfaction and advocacy
June
2014
June
2013 Change
%
Change
Total Revenue and Other Income $M 5,848 6,218 (370) (6)
Revenue Seat Factor %73.3 75.9 (2.6) pts
Underlying EBIT $M 30 365 (335) (92)
Qantas Domestic Underlying EBIT of $30million for the full year ended 30 June 2014 was down from $365million in the prior
corresponding period.
27 May 2014 Macquarie Australia Conference.
28 Net on balance sheet debt includes interest-bearing liabilities and the fair value of hedges related to debt less cash, cash equivalents and aircraft security deposits.
29 Adjusted equity includes equity adjusted to exclude hedge reserves.
30 Gearing Ratio is net debt including operating lease liability to net debt including operating lease liability and adjusted equity. The gearing ratio is used by management to represent the
Qantas Group’s debt obligation including obligations under operating leases.
31 Includes Jetstar Asia, Qantas Freight and Network Aviation and excludes aircraft owned by Jetstar Japan, Jetstar Hong Kong and Jetstar Pacific.