Qantas 2014 Annual Report Download - page 62
Download and view the complete annual report
Please find page 62 of the 2014 Qantas annual report below. You can navigate through the pages in the report by either clicking on the pages listed below, or by using the keyword search tool below to find specific information within the annual report.-
 1
1 -
2
-
3
-
4
-
5
-
6
-
7
-
8
-
9
-
10
-
11
-
12
-
13
-
14
-
15
-
16
-
17
-
18
-
19
-
20
-
21
-
22
-
23
-
24
-
25
-
26
-
27
-
28
-
29
-
30
-
31
-
32
-
33
-
34
-
35
-
36
-
37
-
38
-
39
-
40
-
41
-
42
-
43
-
44
-
45
-
46
-
47
-
48
-
49
-
50
-
51
-
 52
52 -
 53
53 -
 54
54 -
 55
55 -
 56
56 -
 57
57 -
 58
58 -
 59
59 -
 60
60 -
 61
61 -
 62
62 -
 63
63 -
 64
64 -
 65
65 -
 66
66 -
 67
67 -
 68
68 -
 69
69 -
 70
70 -
 71
71 -
 72
72 -
73
-
74
-
75
-
76
-
77
-
78
-
79
-
80
-
81
-
82
-
83
-
84
-
85
-
86
-
87
-
88
-
89
-
90
-
91
-
92
-
93
-
94
-
95
-
96
-
97
-
98
-
99
-
100
-
101
-
102
-
103
-
104
-
105
-
106
-
107
-
108
-
109
-
110
-
111
-
112
-
113
-
114
-
115
-
116
-
117
-
118
-
119
-
120
-
121
-
122
-
123
-
124
-
125
-
126
-
127
-
128
-
129
-
130
-
131
-
132
 |
 |

60
QANTAS ANNUAL REPORT 2014
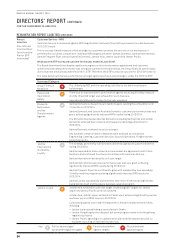
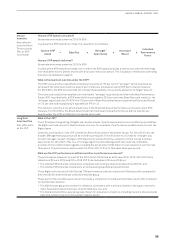
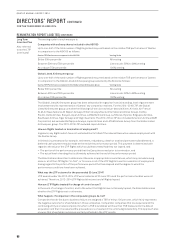
DIRECTORS’ REPORT CONTINUED
FOR THE YEAR ENDED 30 JUNE 2014
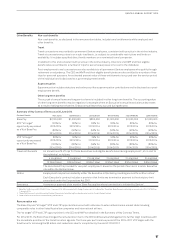
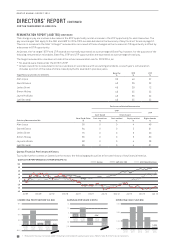
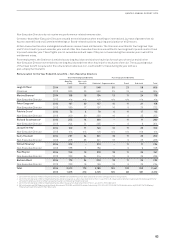
Equity Instruments Held By Key Management Personnel
Set out in the following tables are the holdings of equity instruments granted as remuneration to the KMP by Qantas. Non-Executive
Directors do not receive any remuneration in the form of share-based payments, although they may salary sacrifice a portion of their
Directors’ fees to purchase shares.
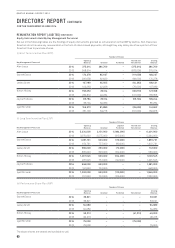
(i) Short Term Incentive Plan (STIP)
Number of Shares
Key Management Personnel
Opening
Balance Granted Forfeited
Vested and
Transferred
Closing
Balance
Alan Joyce 2014 375,014 284,769 –(375,014) 284,769
2013 958,014 – – (583,000) 375,014
Gareth Evans 2014 174,278 85,607 –(111,658) 148,227
2013 200,658 62,620 –(89,000) 174,278
Lesley Grant 2014 107,189 65,505 –(64,263) 108,431
2013 140,263 42,926 –(76,000) 107,18 9
Simon Hickey 2014 158,353 78,16 4 –(109,119) 127,398
2013 230,619 49,234 –(121,500) 158,353
Jayne Hrdlicka 2014 85,784 78,16 4 –(35,704) 128,244
2013 35,704 50,080 – – 85,784
Lyell Strambi 2014 159,373 81,889 –(99,600) 141,662
2013 251,100 59,773 –(151,500) 159,373
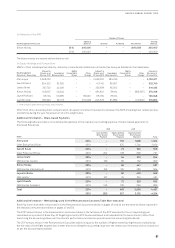
(ii) Long Term Incentive Plan (LTIP)
Number of Shares
Key Management Personnel
Opening
Balance Granted
Lapsed/
Forfeited
Vested and
Transferred
Closing
Balance
Alan Joyce 2014 5,334,000 2,151,000 (1,084,000) –6,401,000
2013 3,074,000 2,575,000 (315,000) –5,334,000
Gareth Evans 2014 1,351,731 633,000 (119,000) –1,865,731
2013 674,731 757,000 (80,000) –1,351,731
Lesley Grant 2014 566,000 253,000 (72,000) –747,000
2013 365,000 303,000 (102,000) –566,000
Simon Hickey 2014 1,091,545 633,000 (104,000) –1,620,545
2013 481,545 757,000 (147,000) –1,091,545
Jayne Hrdlicka 2014 948,000 633,000 – – 1,581,000
2013 191,000 757,000 – – 948,000
Lyell Strambi 2014 1,332,000 633,000 (119,000) –1,846,000
2013 701,000 757,000 (126,000) –1,332,000
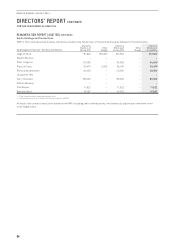
(iii) Performance Share Plan (PSP)
Number of Shares
Key Management Personnel
Opening
Balance Granted Forfeited Transferred
Closing
Balance
Gareth Evans 2014 36,621 –––36,621
2013 36,621 – – – 36,621
Lesley Grant 2014 64,989 – – – 64,989
2013 64,989 – – – 64,989
Simon Hickey 2014 90,213 – – (41,213) 49,000
2013 90,213 –––90,213
Lyell Strambi 2014 75,000 – – (75,000) –
2013 75,000 – – – 75,000
The above shares are vested and available to call.
REMUNERATION REPORT (AUDITED) CONTINUED