Chevron 2007 Annual Report Download - page 99
Download and view the complete annual report
Please find page 99 of the 2007 Chevron annual report below. You can navigate through the pages in the report by either clicking on the pages listed below, or by using the keyword search tool below to find specific information within the annual report.-
 1
1 -
2
-
3
-
4
-
5
-
6
-
7
-
8
-
9
-
10
-
11
-
12
-
13
-
14
-
15
-
16
-
17
-
18
-
19
-
20
-
21
-
22
-
23
-
24
-
25
-
26
-
27
-
28
-
29
-
30
-
31
-
32
-
33
-
34
-
35
-
36
-
37
-
38
-
39
-
40
-
41
-
42
-
43
-
44
-
45
-
46
-
47
-
48
-
49
-
50
-
51
-
52
-
53
-
54
-
55
-
56
-
57
-
58
-
59
-
60
-
61
-
62
-
63
-
64
-
65
-
66
-
67
-
68
-
69
-
70
-
71
-
72
-
73
-
74
-
75
-
76
-
77
-
78
-
79
-
80
-
81
-
82
-
83
-
84
-
85
-
86
-
87
-
88
-
 89
89 -
 90
90 -
 91
91 -
 92
92 -
 93
93 -
 94
94 -
 95
95 -
 96
96 -
 97
97 -
 98
98 -
 99
99 -
 100
100 -
 101
101 -
 102
102 -
 103
103 -
 104
104 -
 105
105 -
 106
106 -
 107
107 -
 108
108
 |
 |

97
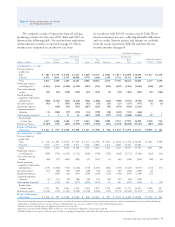
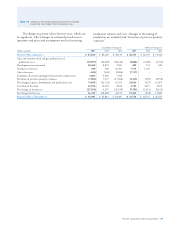
Net Proved Reserves of Natural Gas
Consolidated Companies
United States International
Gulf of Total Asia- Total Affiliated Companies
Billions of cubic feet Calif. Mexico Other U.S. Africa Pacific Indonesia Other Int’l. Total TCO Other
Reserves at Jan. 1, 2005 314 1,064 2,326 3,704 2,979 5,405 502 3,538 12,424 16,128 3,413 134
Changes attributable to:
Revisions 21 (15) (15) (9) 211 (428) (31) 243 (5) (14) (547) 49
Improved recovery 8 – – 8 13 – – 31 44 52 – –
Extensions and
discoveries – 68 99 167 25 118 5 55 203 370 – –
Purchases1 – 269 899 1,168 5 3,962 247 274 4,488 5,656 – –
Sales2 – – (6) (6) – – – (248) (248) (254) – –
Production (39) (215) (350) (604) (42) (434) (77) (315) (868) (1,472) (79) (2)
Reserves at Dec. 31, 20053 304 1,171 2,953 4,428 3,191 8,623 646 3,578 16,038 20,466 2,787 181
Changes attributable to:
Revisions 32 40 (102) (30) 34 400 38 39 511 481 26 –
Improved recovery 5 – – 5 3 – – 5 8 13 – –
Extensions and
discoveries – 111 157 268 11 510 – 10 531 799 – –
Purchases1 6 13 – 19 – 16 – – 16 35 – 54
Sales2 – – (1) (1) – – – (148) (148) (149) – –
Production (37) (241) (383) (661) (33) (629) (110) (302) (1,074) (1,735) (70) (4)
Reserves at Dec. 31, 20063 310 1,094 2,624 4,028 3,206 8,920 574 3,182 15,882 19,910 2,743 231
Changes attributable to:
Revisions 40 39 130 209 (141) 149 12 166 186 395 75 (2)
Improved recovery – – – – – – – 1 1 1 – –
Extensions and
discoveries – 40 46 86 11 392 – 29 432 518 – –
Purchases1 2 19 29 50 – 91 – – 91 141 – 211
Sales2 – (39) (37) (76) – – – – – (76) – (175)
Production (35) (210) (375) (620) (27) (725) (101) (279) (1,132) (1,752) (70) (10)
Reserves at Dec. 31, 20073,4 317 943 2,417 3,677 3,049 8,827 485 3,099 15,460 19,137 2,748 255
Developed Reserves5
At Jan. 1, 2005 252 937 2,191 3,380 1,108 3,701 271 2,273 7,353 10,733 2,584 63
At Dec. 31, 2005 251 977 2,794 4,022 1,346 4,819 449 2,453 9,067 13,089 2,314 85
At Dec. 31, 2006 250 873 2,434 3,557 1,306 4,751 377 1,912 8,346 11,903 1,412 144
At Dec. 31, 2007 261 727 2,238 3,226 1,151 5,081 326 1,915 8,473 11,699 1,762 117
1 Includes reserves acquired through nonmonetary transactions.
2 Includes reserves disposed of through nonmonetary transactions.
3 Includes year-end reserve quantities related to production-sharing contracts (PSC) (refer to page 28 for the definition of a PSC). PSC-related reserve quantities are 37 percent,
47 percent and 44 percent for consolidated companies for 2007, 2006 and 2005, respectively.
4 Net reserve changes (excluding production) in 2007 consist of 1,548 billion cubic feet of developed reserves and (569) billion cubic feet of undeveloped reserves for consolidated
companies and 403 billion cubic feet of developed reserves and (294) billion cubic feet of undeveloped reserves for affiliated companies.
5 During 2007, the percentages of undeveloped reserves at December 31, 2006, transferred to developed reserves were 10 percent and 27 percent for consolidated companies and
affiliated companies, respectively.
Noteworthy amounts in the categories of natural gas
proved-reserve changes for 2005 through 2007 are dis-
cussed below:
Revisions In 2005, reserves were revised downward by 14
billion cubic feet (BCF) for consolidated companies and 498
BCF for equity affiliates. For consolidated companies, nega-
tive revisions were 428 BCF in the Asia-Pacific region. Most
of the decrease was attributable to one field in Kazakhstan,
due mainly to the effects of higher year-end prices on vari-
able-royalty provisions of the production-sharing contract.
Reserves additions for consolidated companies totaled 211
BCF and 243 BCF in Africa and “Other,” respectively. The
majority of the African region changes were in Angola, due
to a revised forecast of fuel gas usage, and in Nigeria, from
improved reservoir performance. The availability of third-
party compression in Colombia accounted for most of the
increase in the “Other” region. Revisions in the United States
decreased reserves by 9 BCF, as nominal increases in the
San Joaquin Valley were more than offset by decreases in the
Gulf of Mexico and “Other” region. For the TCO affiliate
in Kazakhstan, a reduction of 547 BCF reflects the updated
forecast of future royalties payable and year-end price effects,
partially offset by volumes added as a result of an updated
assessment of reservoir performance.