Chevron 2007 Annual Report Download - page 80
Download and view the complete annual report
Please find page 80 of the 2007 Chevron annual report below. You can navigate through the pages in the report by either clicking on the pages listed below, or by using the keyword search tool below to find specific information within the annual report.-
 1
1 -
2
-
3
-
4
-
5
-
6
-
7
-
8
-
9
-
10
-
11
-
12
-
13
-
14
-
15
-
16
-
17
-
18
-
19
-
20
-
21
-
22
-
23
-
24
-
25
-
26
-
27
-
28
-
29
-
30
-
31
-
32
-
33
-
34
-
35
-
36
-
37
-
38
-
39
-
40
-
41
-
42
-
43
-
44
-
45
-
46
-
47
-
48
-
49
-
50
-
51
-
52
-
53
-
54
-
55
-
56
-
57
-
58
-
59
-
60
-
61
-
62
-
63
-
64
-
65
-
66
-
67
-
68
-
69
-
 70
70 -
 71
71 -
 72
72 -
 73
73 -
 74
74 -
 75
75 -
 76
76 -
 77
77 -
 78
78 -
 79
79 -
 80
80 -
 81
81 -
 82
82 -
 83
83 -
 84
84 -
 85
85 -
 86
86 -
 87
87 -
 88
88 -
 89
89 -
 90
90 -
91
-
92
-
93
-
94
-
95
-
96
-
97
-
98
-
99
-
100
-
101
-
102
-
103
-
104
-
105
-
106
-
107
-
108
 |
 |

78
Expected Return on Plan Assets The company’s estimated
long-term rate of return on pension assets is driven pri marily
by actual historical asset-class returns, an assessment of
expected future performance, advice from external actuarial
firms and the incorporation of specific asset-class risk factors.
Asset allocations are periodically updated using pension plan
asset/liability studies, and the company’s estimated long-term
rates of return are consistent with these studies.
There have been no changes in the expected long-term
rate of return on plan assets since 2002 for U.S. plans, which
account for 67 percent of the company’s pension plan assets.
At December 31, 2007, the estimated long-term rate of return
on U.S. pension plan assets was 7.8 percent.
The market-related value of assets of the major U.S. pen-
sion plan used in the determination of pension expense was
based on the market values in the three months preceding
the year-end measurement date, as opposed to the maximum
allowable period of five years under U.S. accounting rules.
Management considers the three-month time period long
enough to minimize the effects of distortions from day-to-
day market volatility and still be contemporaneous to the end
of the year. For other plans, market value of assets as of the
measurement date is used in calculating the pension expense.
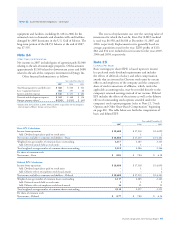
Discount Rate The discount rate assumptions used to deter-
mine U.S. and international pension and postretirement
benefit plan obligations and expense reflect the prevailing
rates available on high-quality, fixed-income debt instruments.
At December 31, 2007, the company selected a 6.3 percent
discount rate for the major U.S. pension and postretirement
plans. This rate was based on a cash flow analysis that
matched estimated future benefit payments to the Citigroup
Pension Discount Yield Curve as of year-end 2007. The dis-
count rates at the end of 2006 and 2005 were 5.8 percent
and 5.5 percent, respectively.
Other Benefit Assumptions For the measurement of accumu-
lated postretirement benefit obligation at December 31, 2007,
for the main U.S. postretirement medical plan, the assumed
health care cost-trend rates start with 8 percent in 2008 and
gradually decline to 5 percent for 2014 and beyond. For this
measurement at December 31, 2006, the assumed health care
cost-trend rates started with 9 percent in 2007 and gradually
declined to 5 percent for 2011 and beyond. In both measure-
ments, the annual increase to company contributions was
capped at 4 percent.
Assumed health care cost-trend rates can have a signifi-
cant effect on the amounts reported for retiree health care
costs. The impact is mitigated by the 4 percent cap on the
company’s medical contributions for the primary U.S. plan.
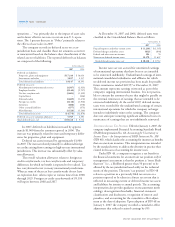
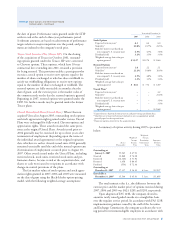
A one-percentage-point change in the assumed health care
cost-trend rates would have the following effects:
1 Percent 1 Percent
Increase Decrease
Effect on total service and interest cost components $ 9 $ (8)
Effect on postretirement benefit obligation $ 86 $ (75)
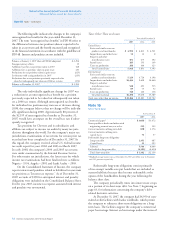
Plan Assets and Investment Strategy The company’s pension
plan weighted-average asset allocations at December 31 by
asset category are as follows:
U.S. International
Asset Category 2007 2006 2007 2006
Equities 64% 68% 56% 62%
Fixed Income 23% 21% 43% 37%
Real Estate 12% 10% 1% 1%
Other 1% 1% – –
Total 100% 100% 100% 100%
The pension plans invest primarily in asset categories with
sufficient size, liquidity and cost efficiency to permit invest-
ments of reasonable size. The pension plans invest in asset
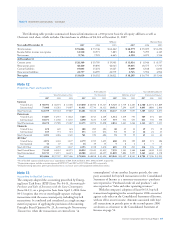
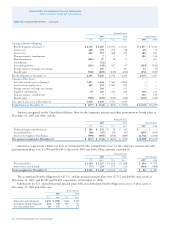
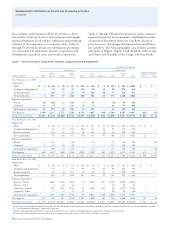
Assumptions The following weighted-average assumptions were used to determine benefit obligations and net periodic benefit costs
for years ended December 31:
Pension Benefits
2007 2006 2005 Other Benefits
U.S. Int’l. U.S. Int’l. U.S. Int’l. 2007 2006 2005
Assumptions used to determine
benefit obligations
Discount rate 6.3% 6.7% 5.8% 6.0% 5.5% 5.9% 6.3% 5.8% 5.6%
Rate of compensation increase 4.5% 6.4% 4.5% 6.1% 4.0% 5.1% 4.5% 4.5% 4.0%
Assumptions used to determine
net periodic benefit cost
Discount rate1,2 5.8% 6.0% 5.8% 5.9% 5.5% 6.4% 5.8% 5.9% 5.8%
Expected return on plan assets1 7.8% 7.5% 7.8% 7.4% 7.8% 7.9% N/A N/A N/A
Rate of compensation increase1 4.5% 6.1% 4.2% 5.1% 4.0% 5.0% 4.5% 4.2% 4.0%
1 The 2005 discount rate, expected return on plan assets and rate of compensation increase reflect the remeasurement of the acquired Unocal benefit plans at July 31, 2005.
2 The 2006 U.S. discount rate reflects remeasurement on July 1, 2006, due to plan combinations and changes, primarily several Unocal plans into related Chevron plans.
Notes to the Consolidated Financial Statements